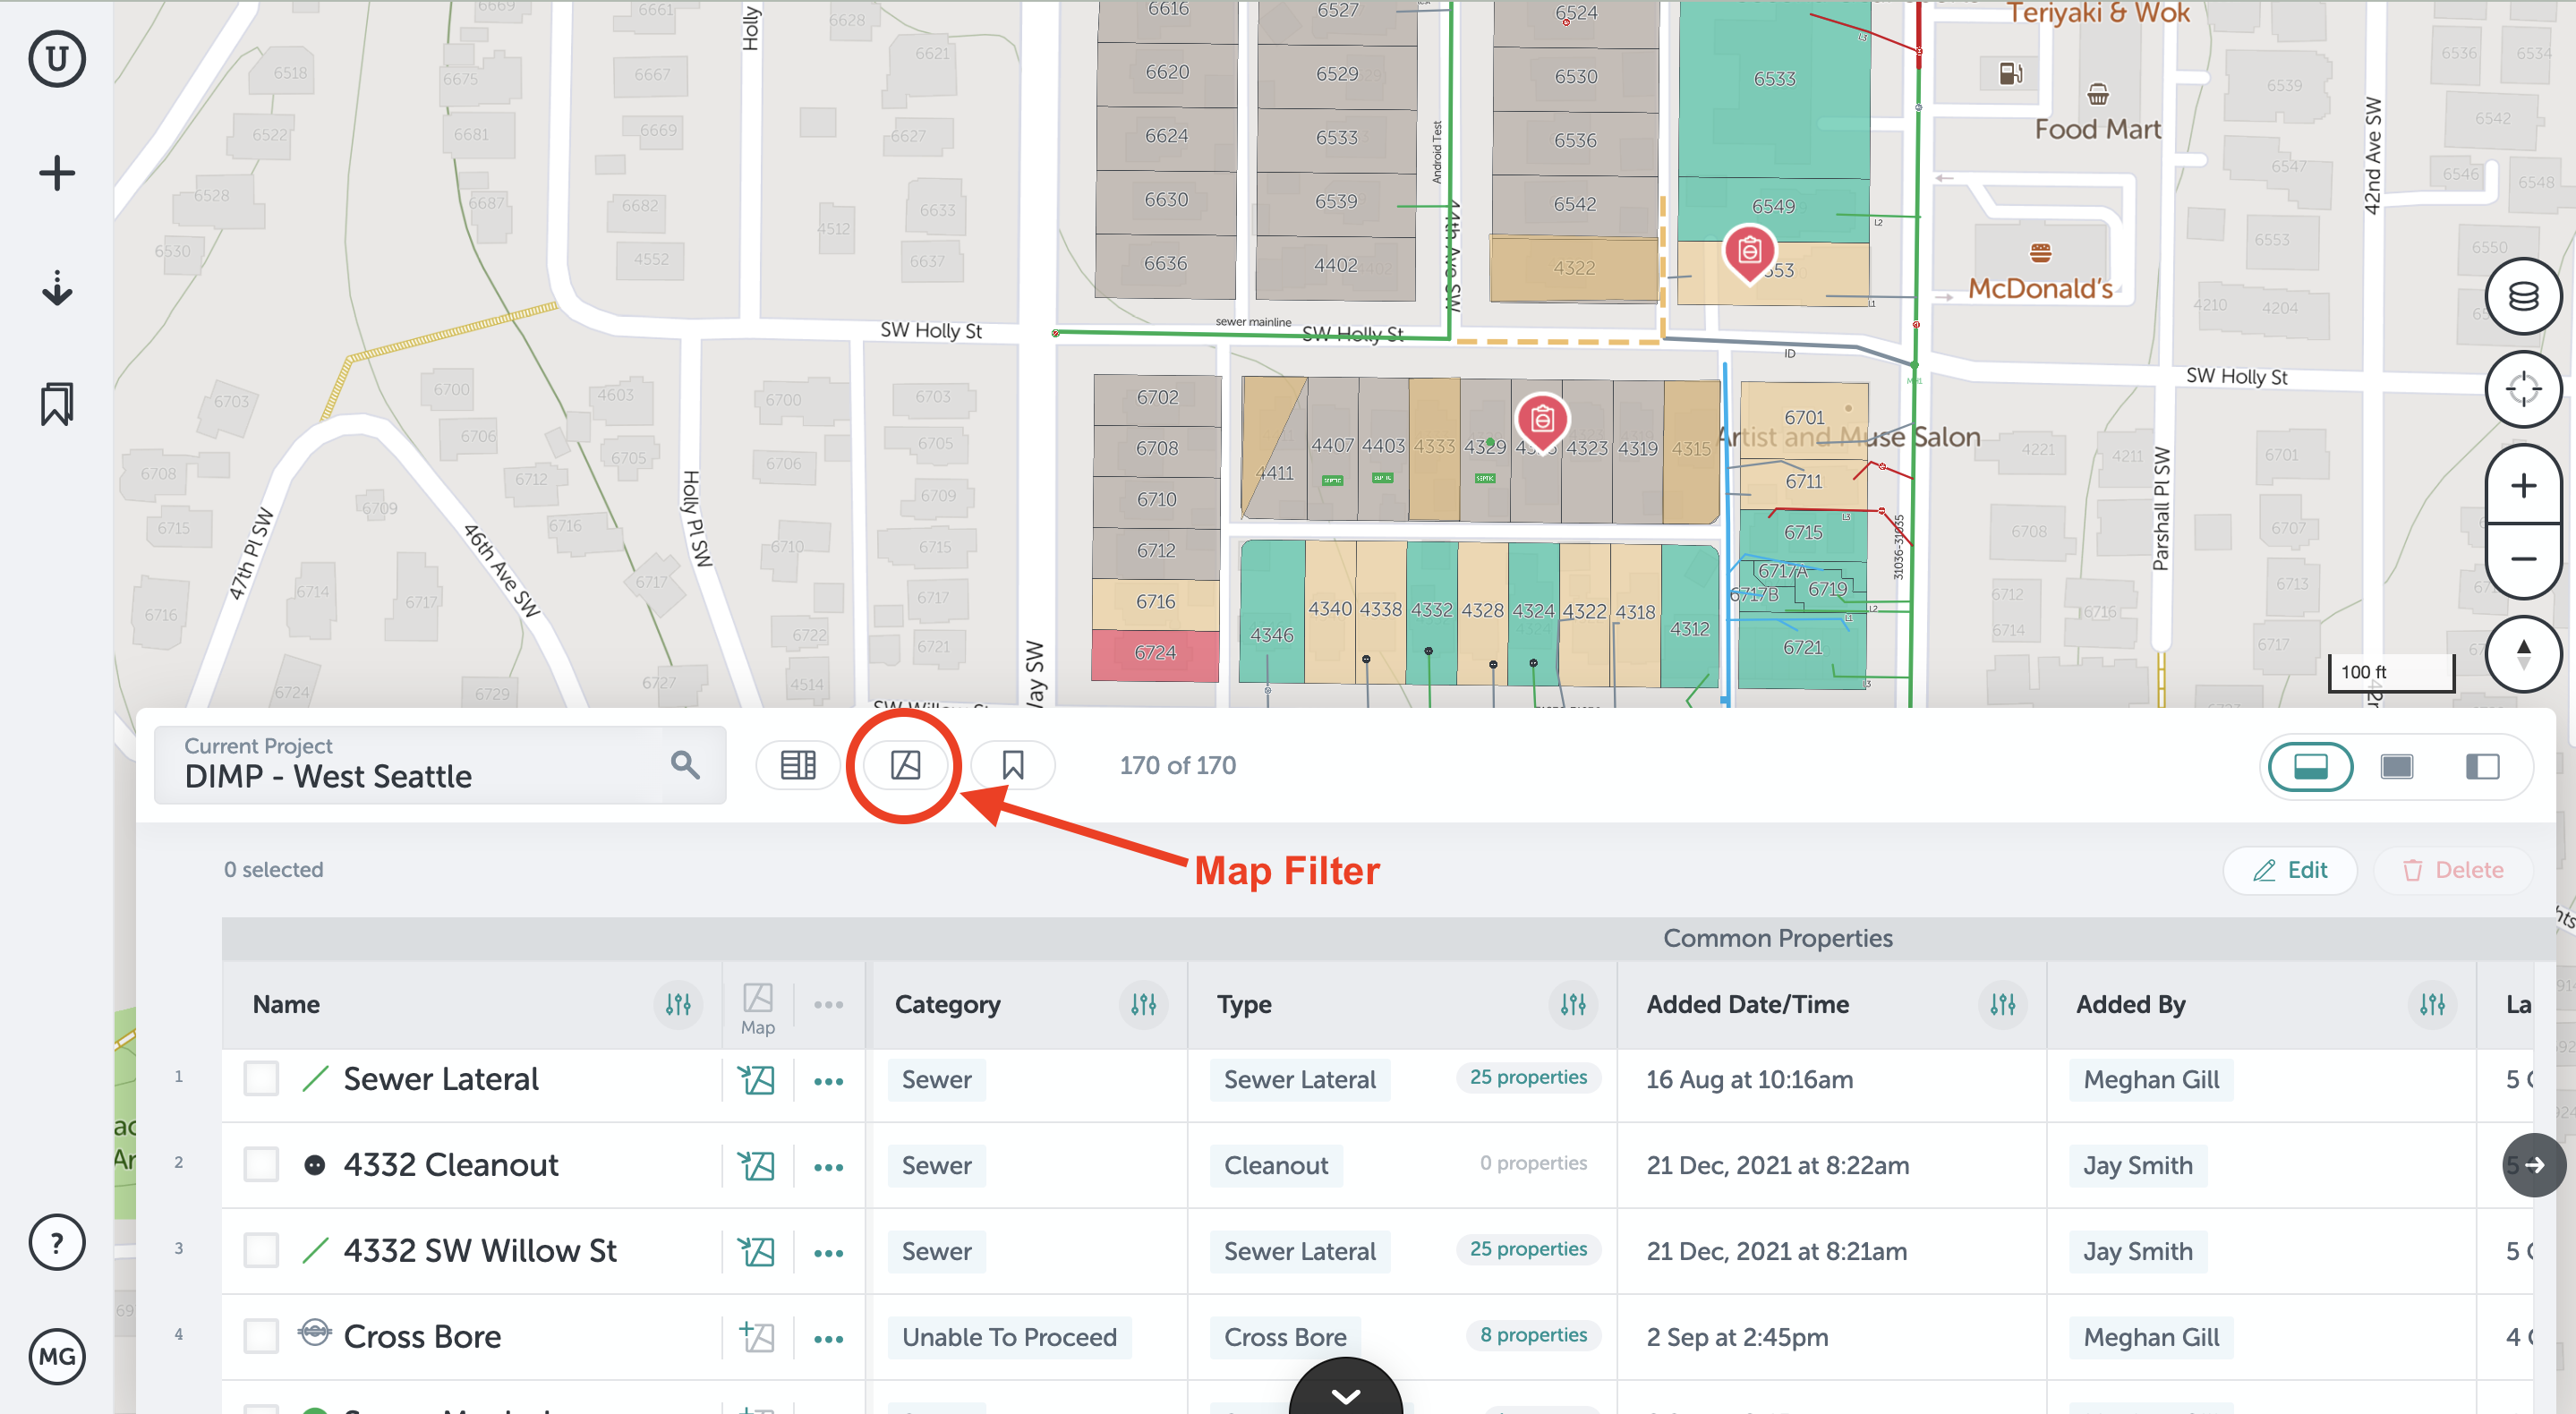
Map filters in the Table View are a powerful tool to refine what is displayed on the map or in the table based on map features.
The map filter button allows you to filter based on map features rather than properties. This filter defaults to “Any,” but you can choose to filter on several options.
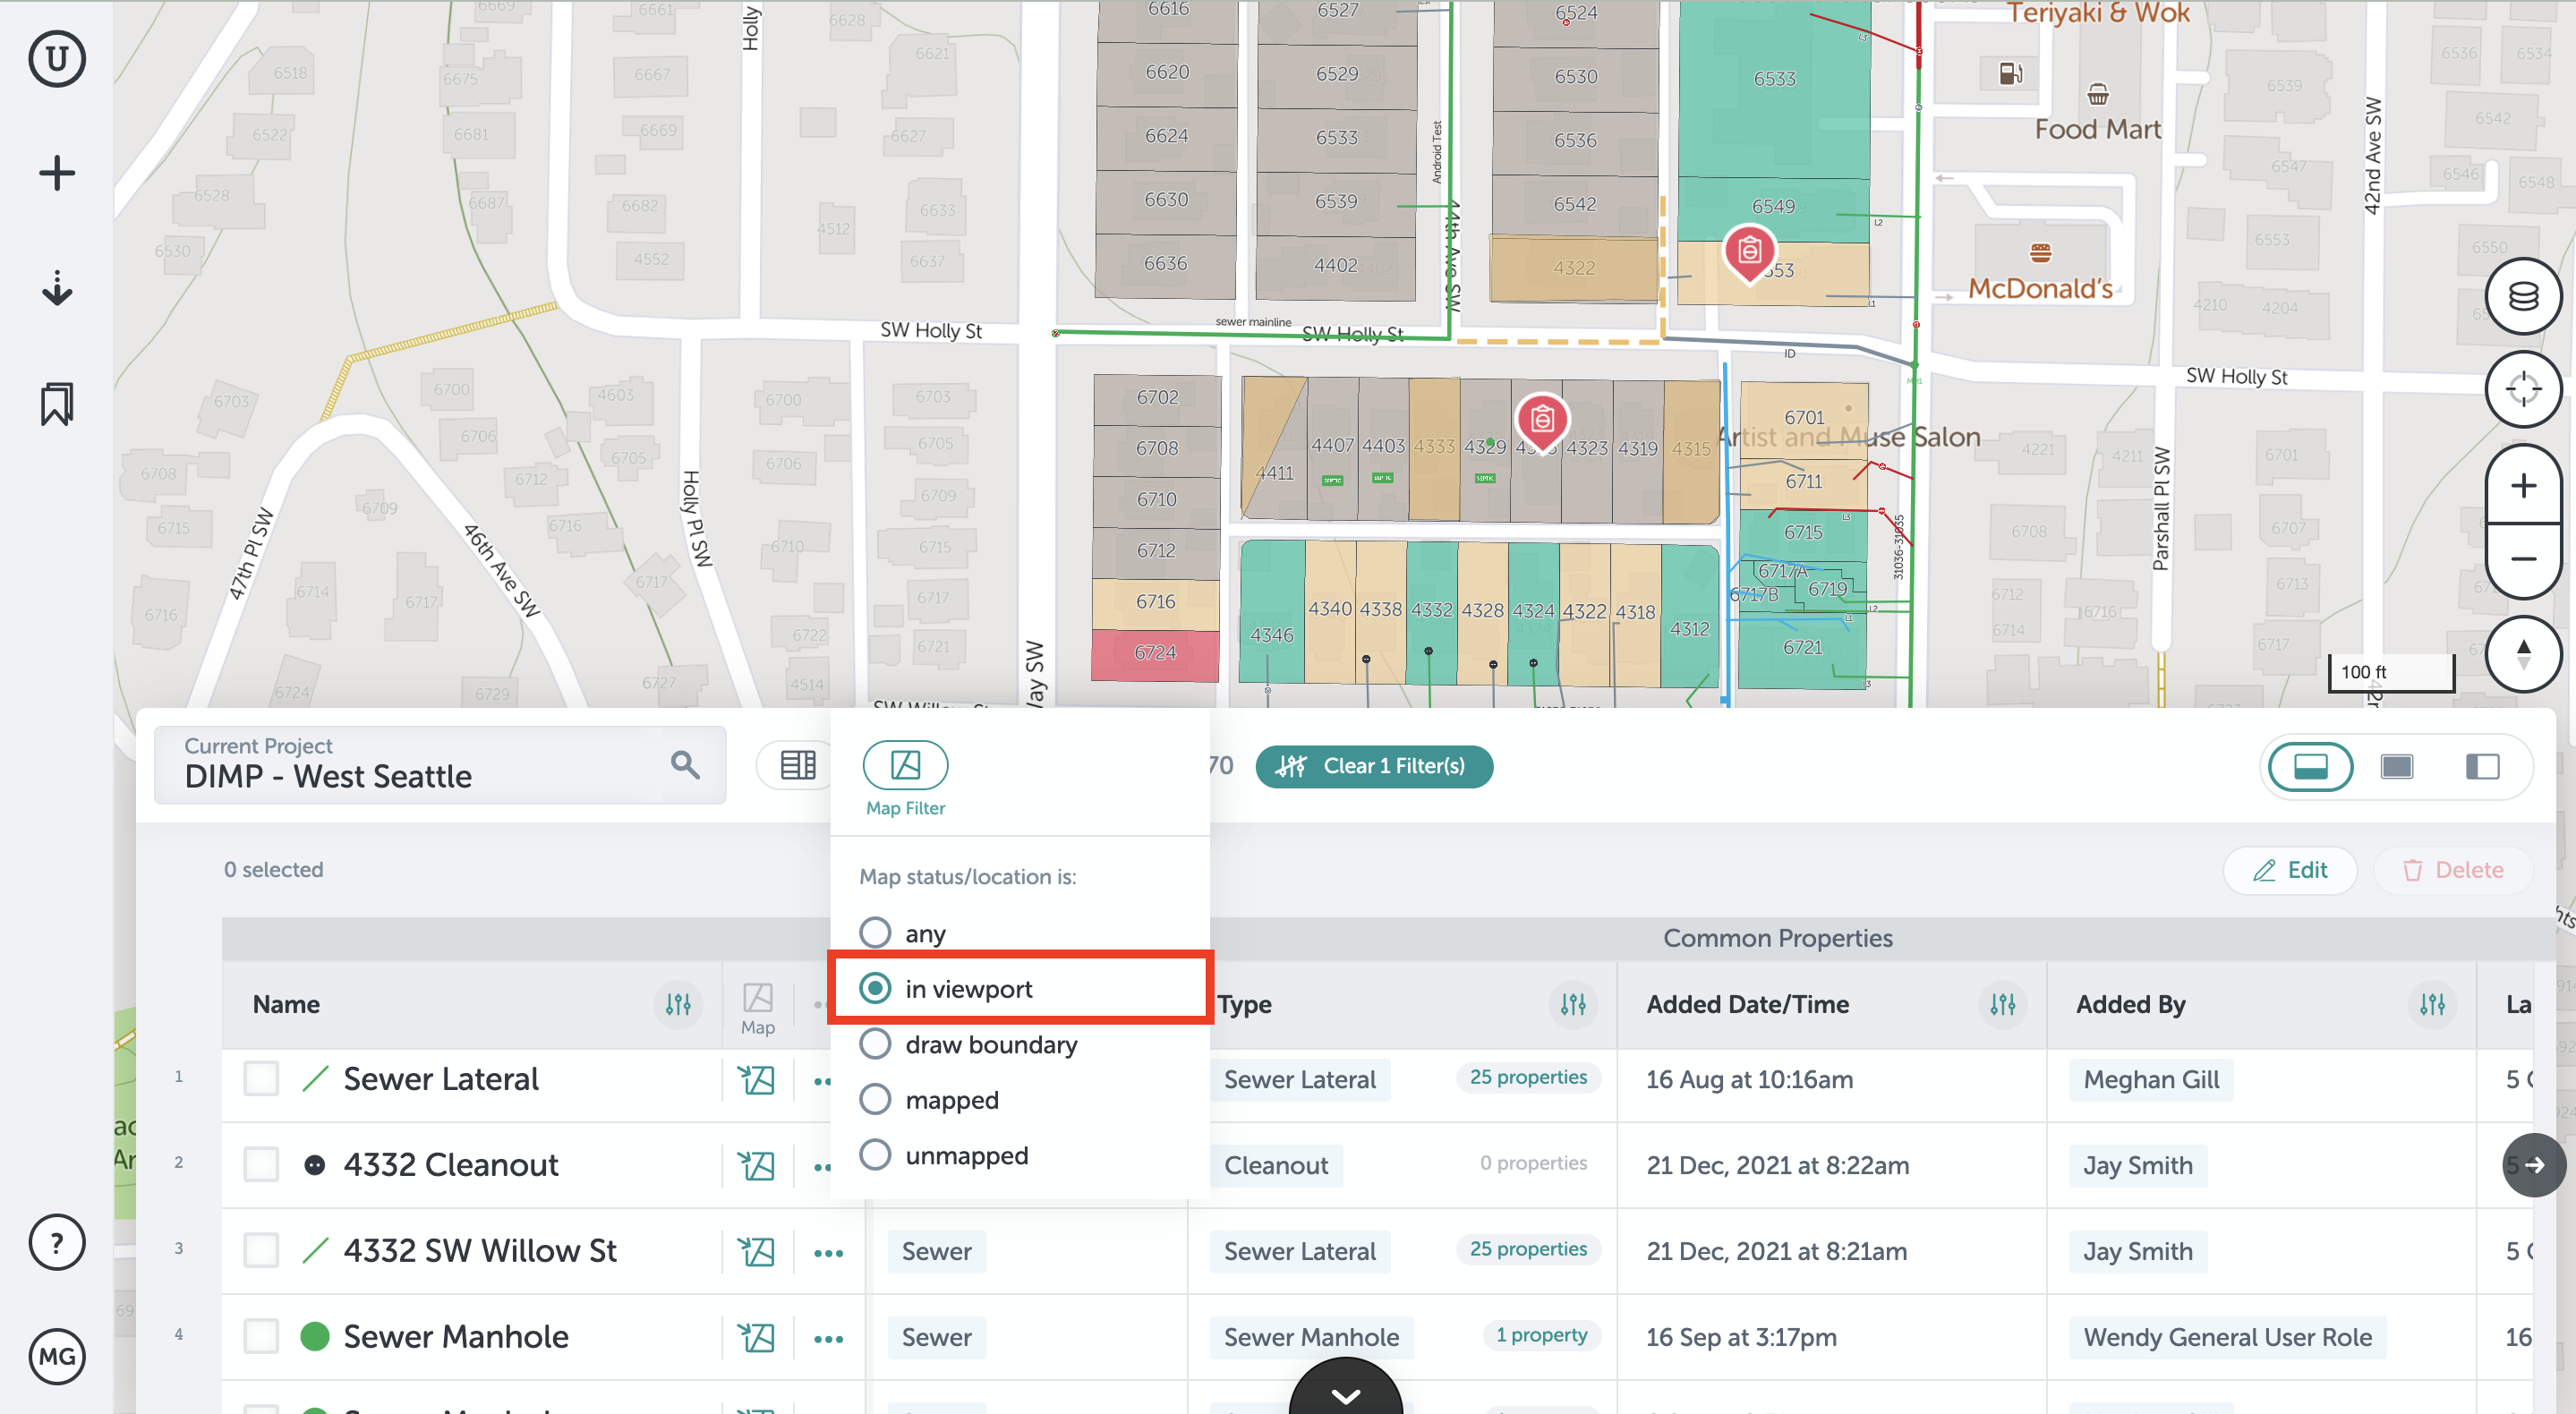
In Viewport:
- Apply the "In Viewport" filter to filter based on what is currently visible on your computer screen, which includes the area underneath the table view. It will filter OUT anything that is not currently visible on your screen. This option is helpful especially when working in a large project where you may only be working in a small area. It will only attempt to load assets within the specified area.
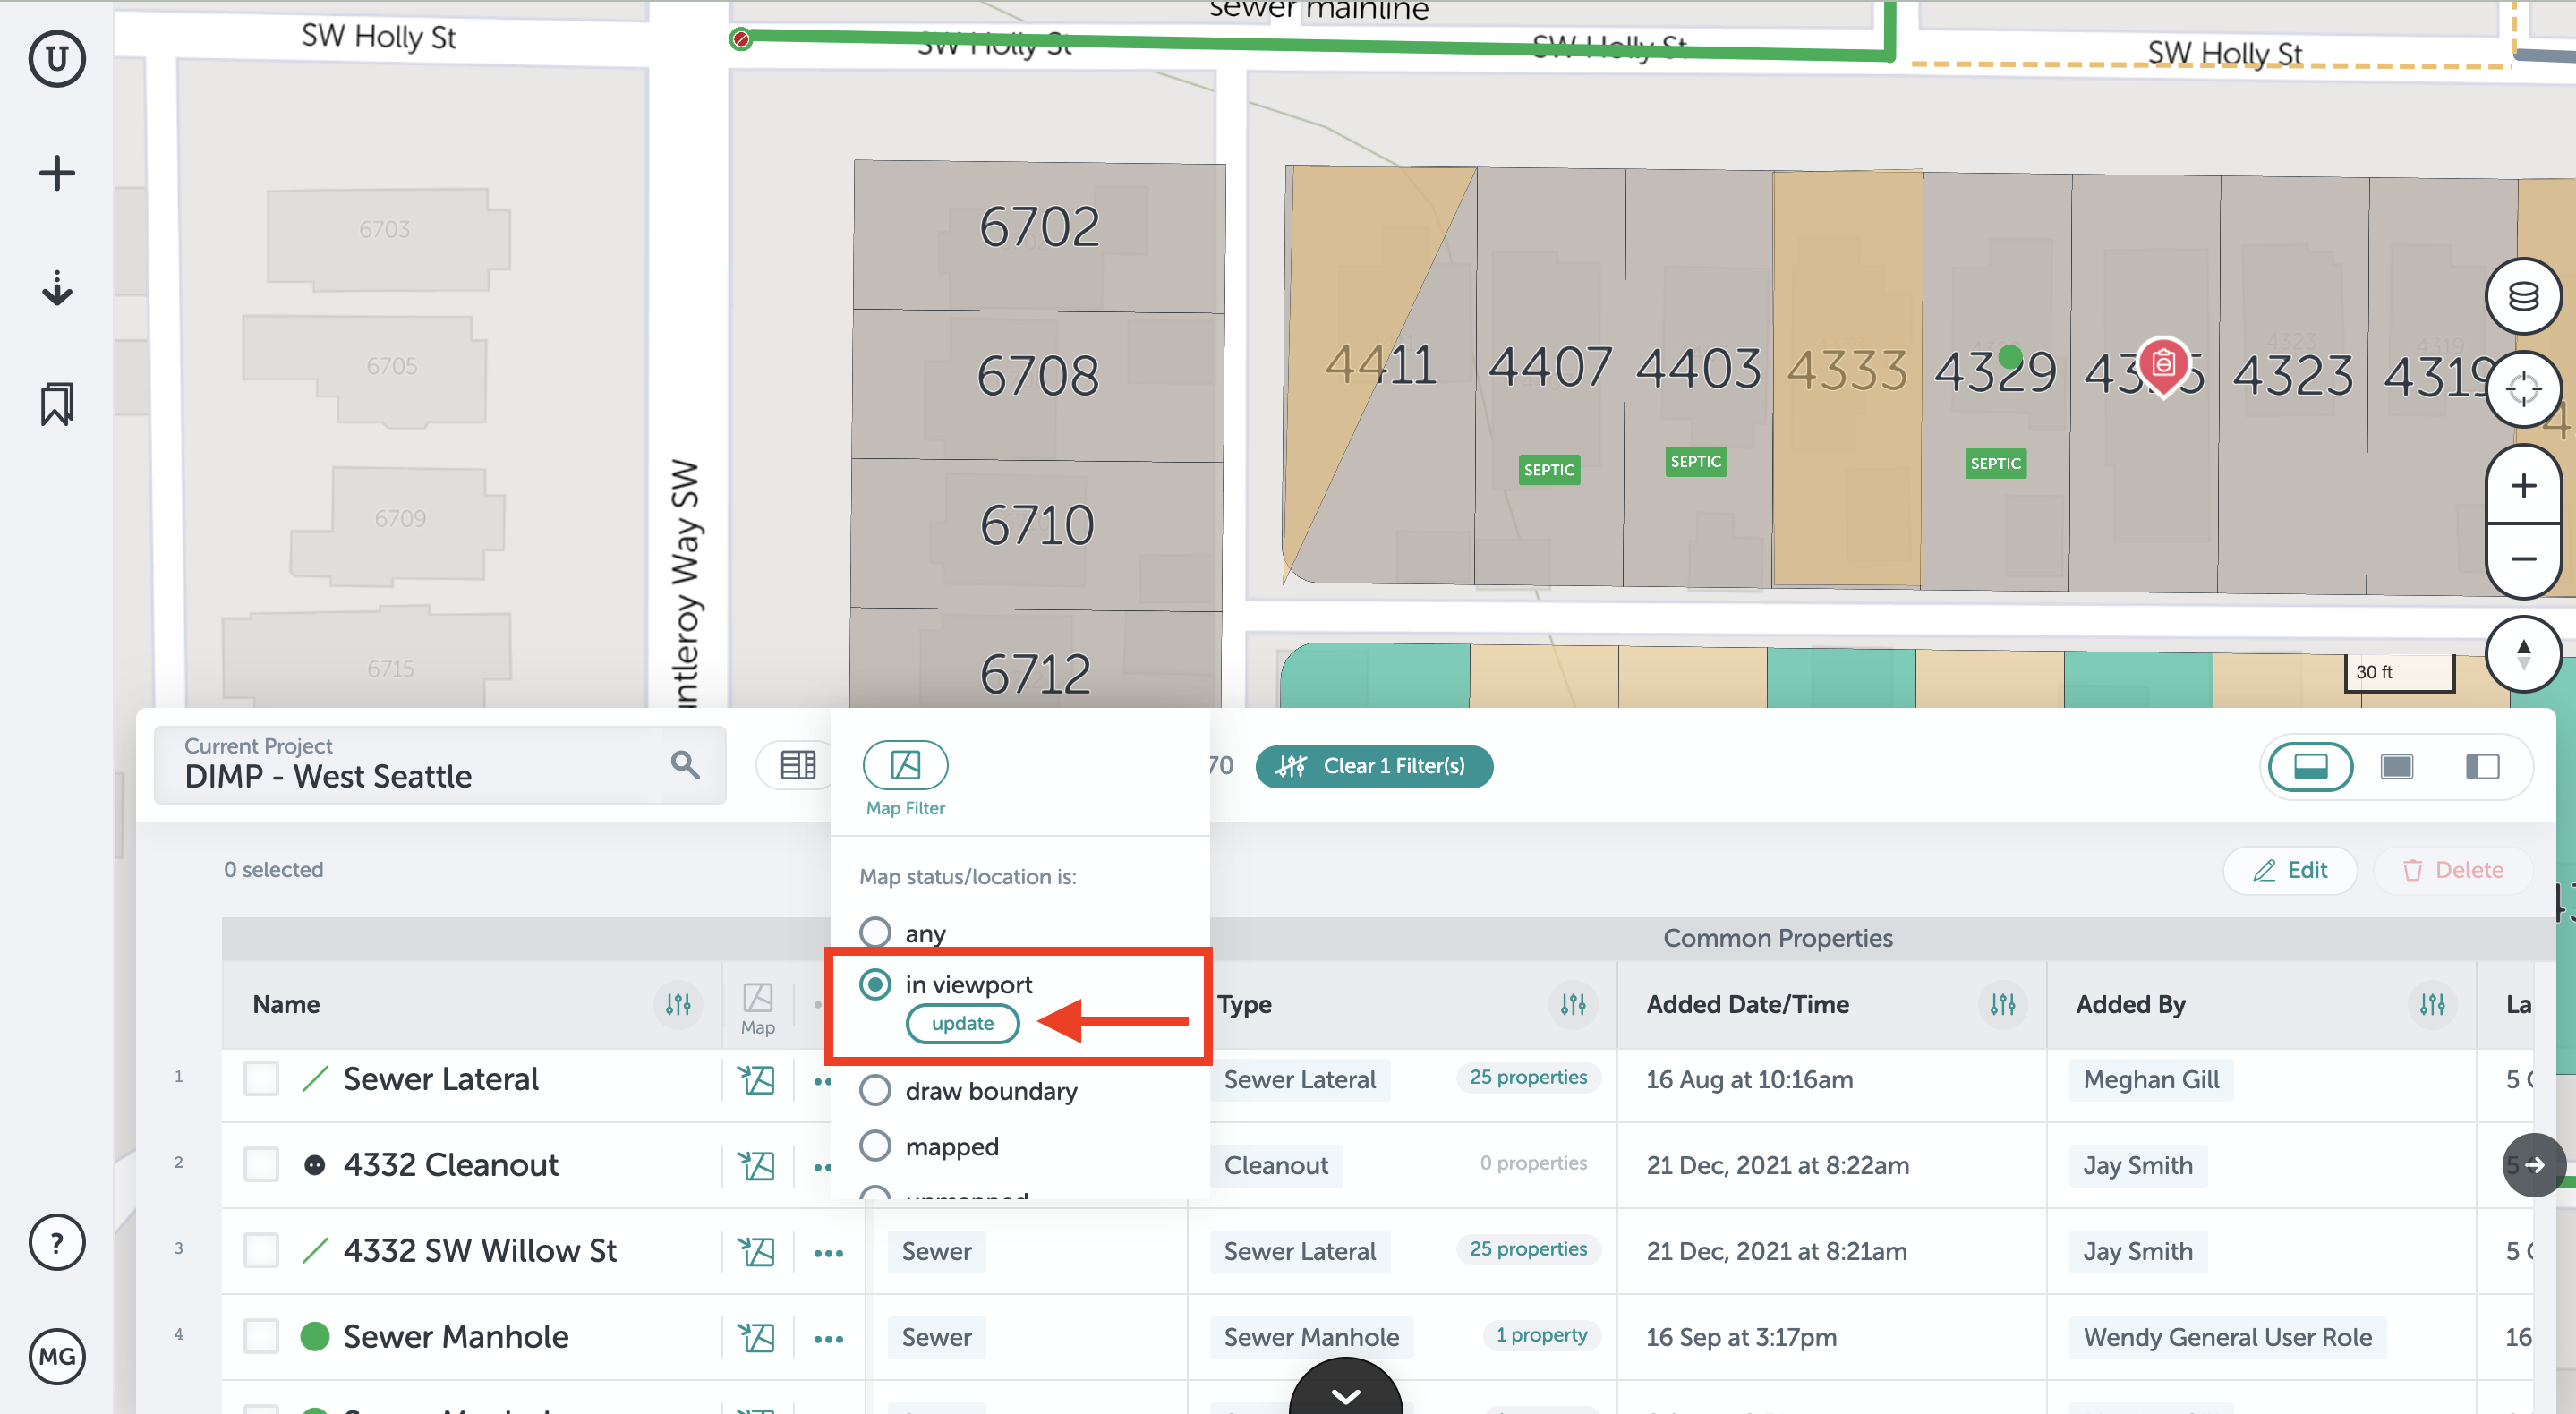
- Zooming in or out before enabling the filter will change what is included. If you apply the filter and then zoom, you will be shown the option to “update” which will adjust to filter whatever is now in view.
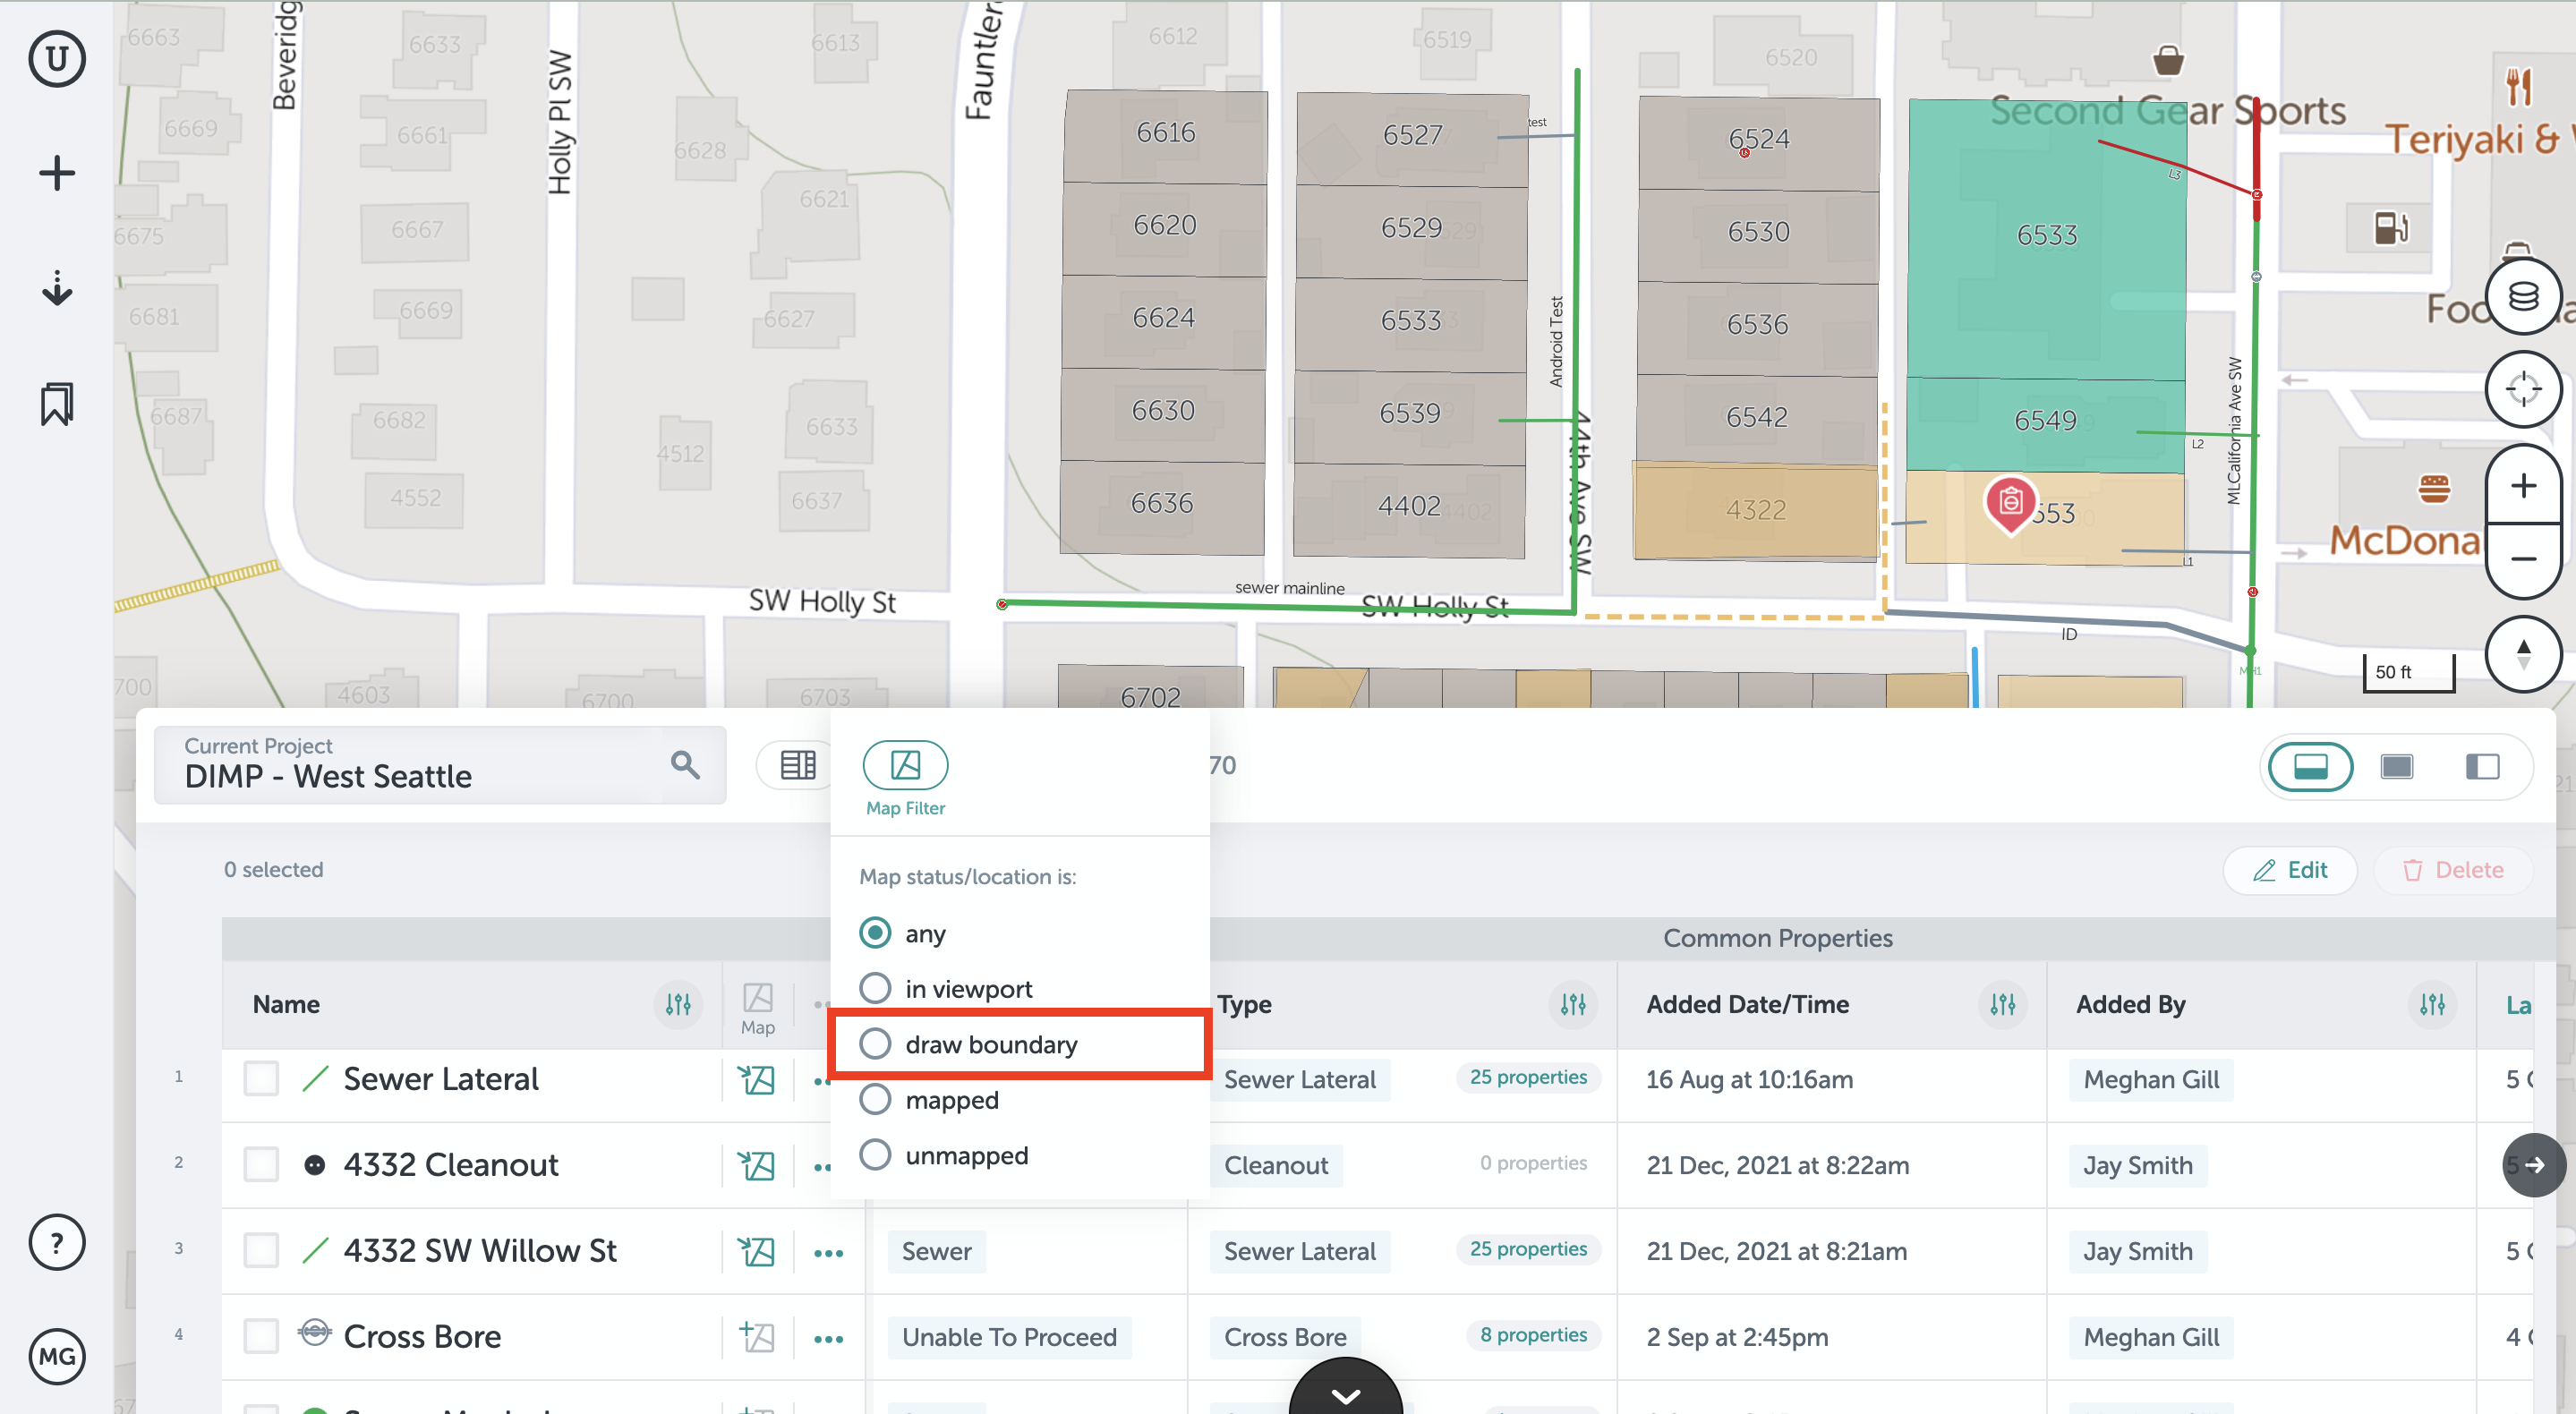
Draw Boundary:
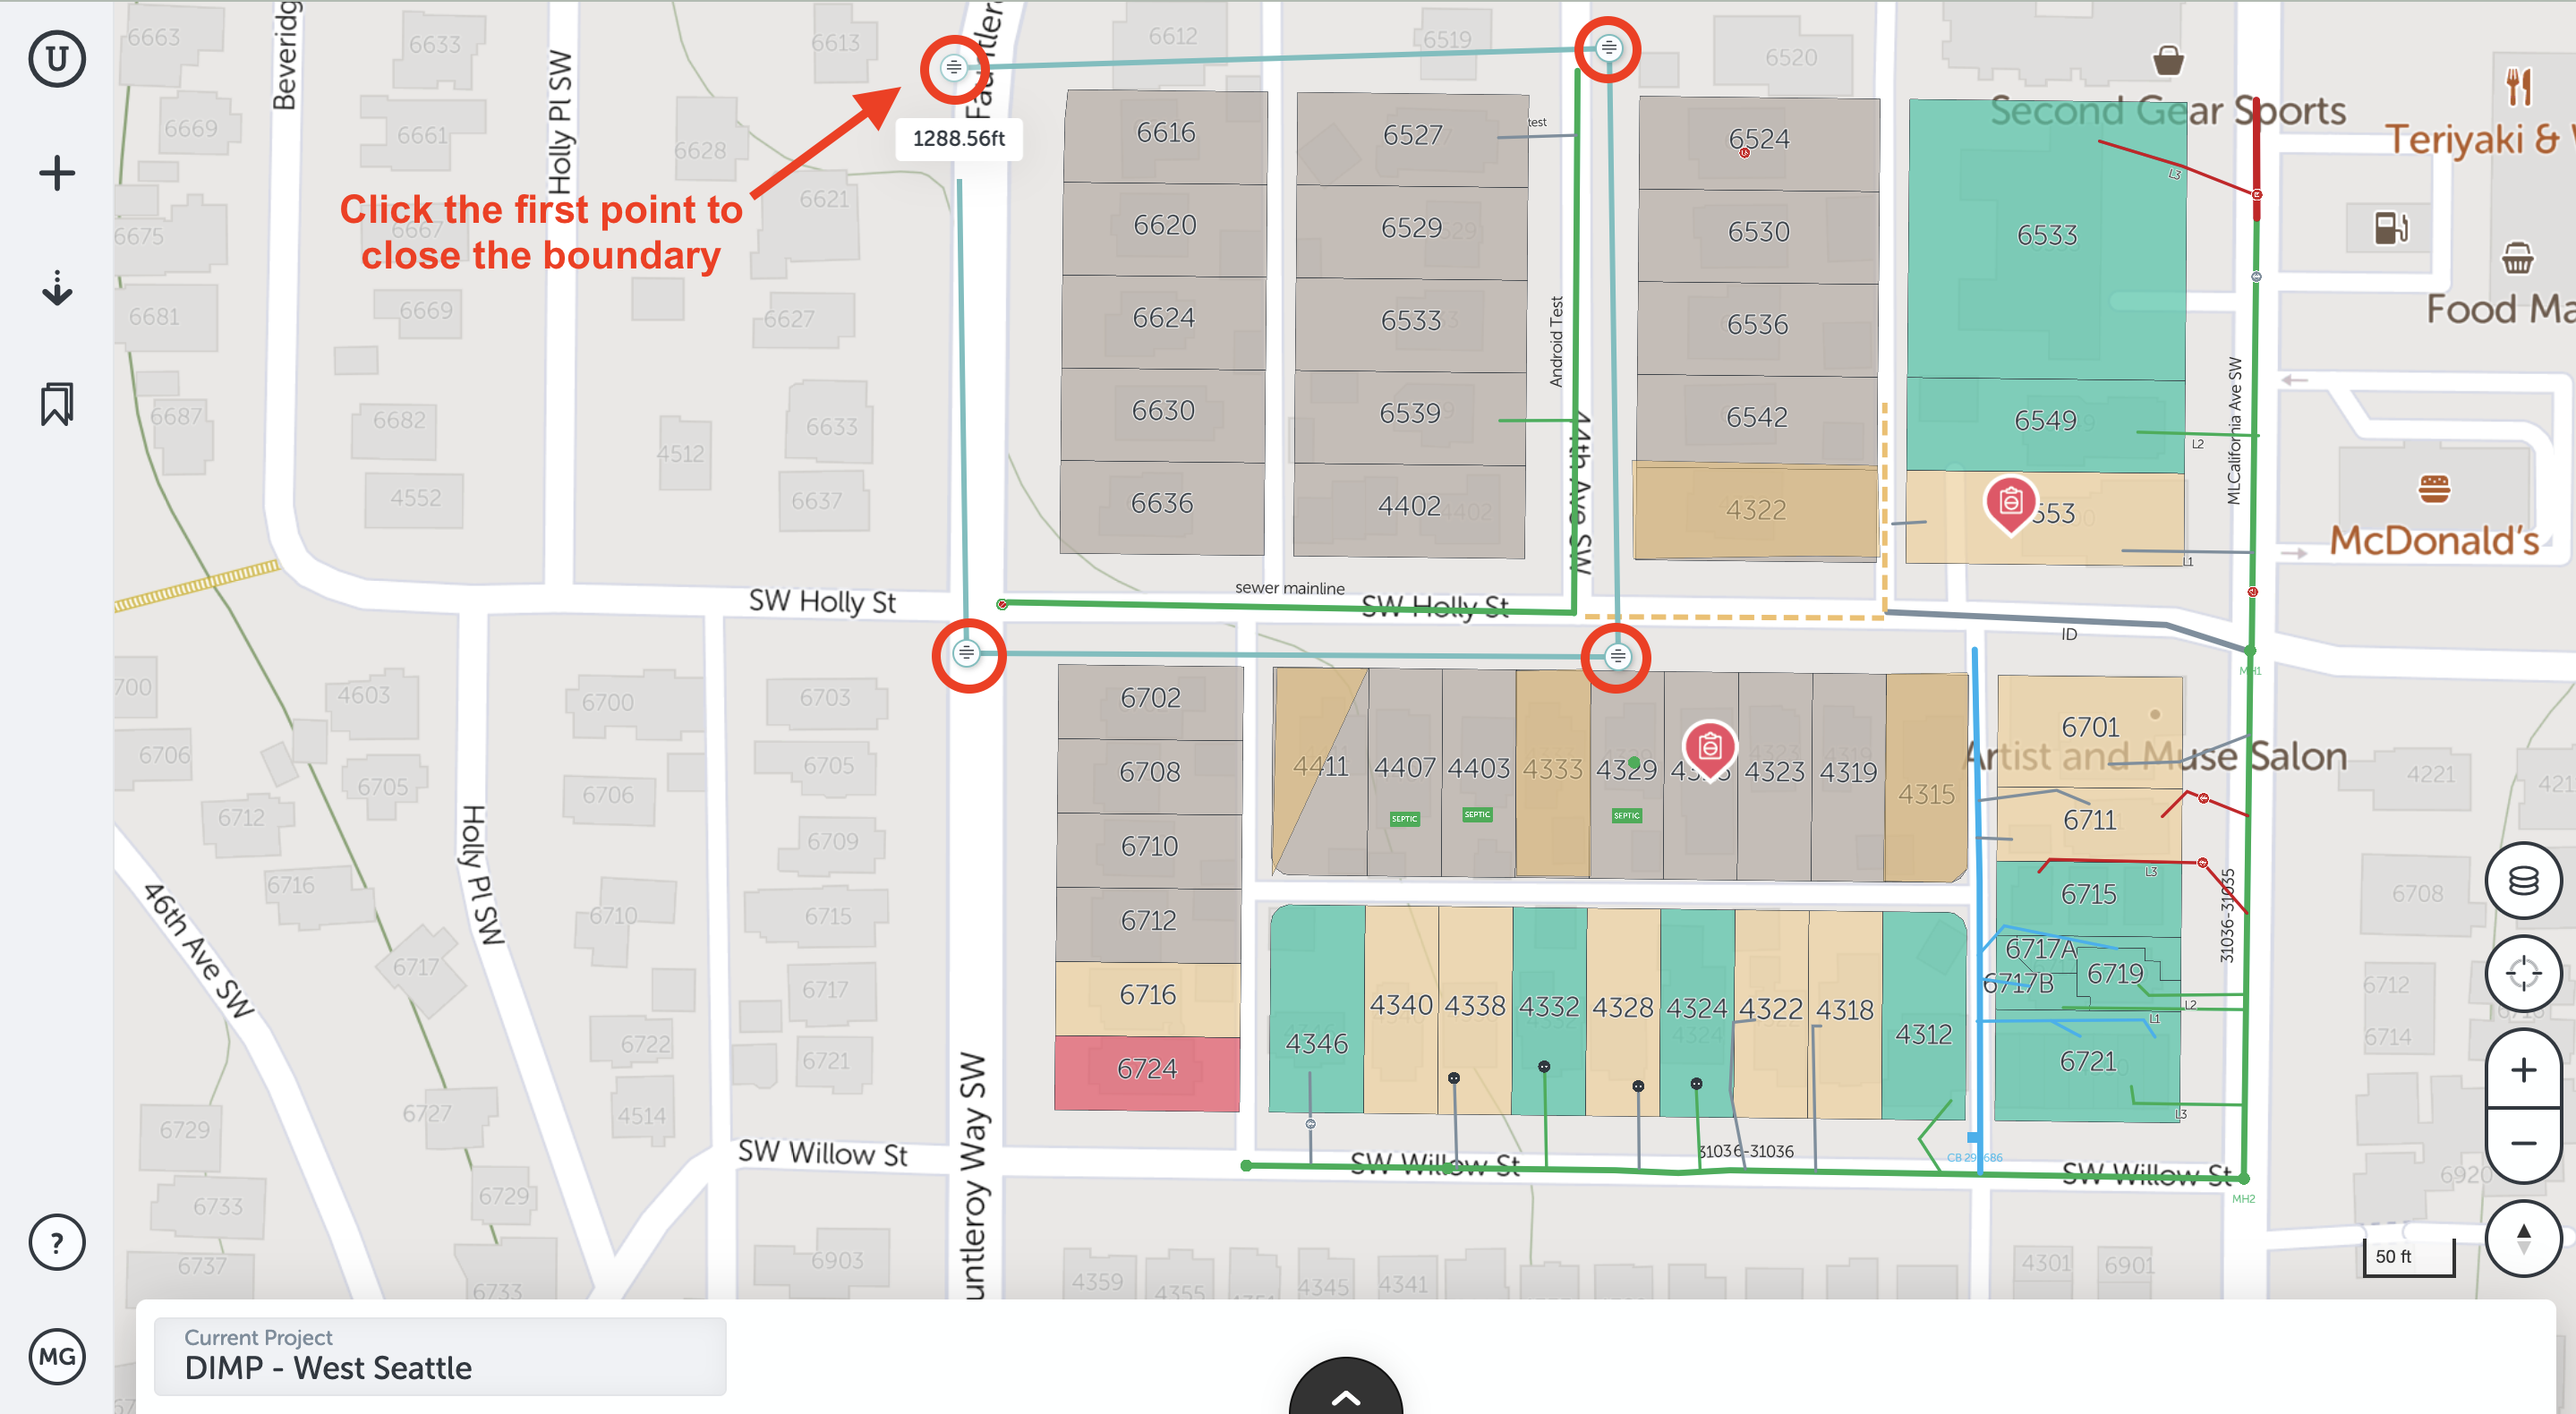
- The "Draw Boundary" filter option allows you to manually draw a shape around the area you want filtered, and then filter out anything not within the drawn boundary. This can be helpful if you only want to evaluate data added within a certain region, such as a particular neighborhood. First, select the “draw boundary” map filter.
- Draw the boundary on the map by clicking to place vertices, drawing a polygon shape around the data you wish to view. Click the first vertice placed to close the polygon, applying the filter.
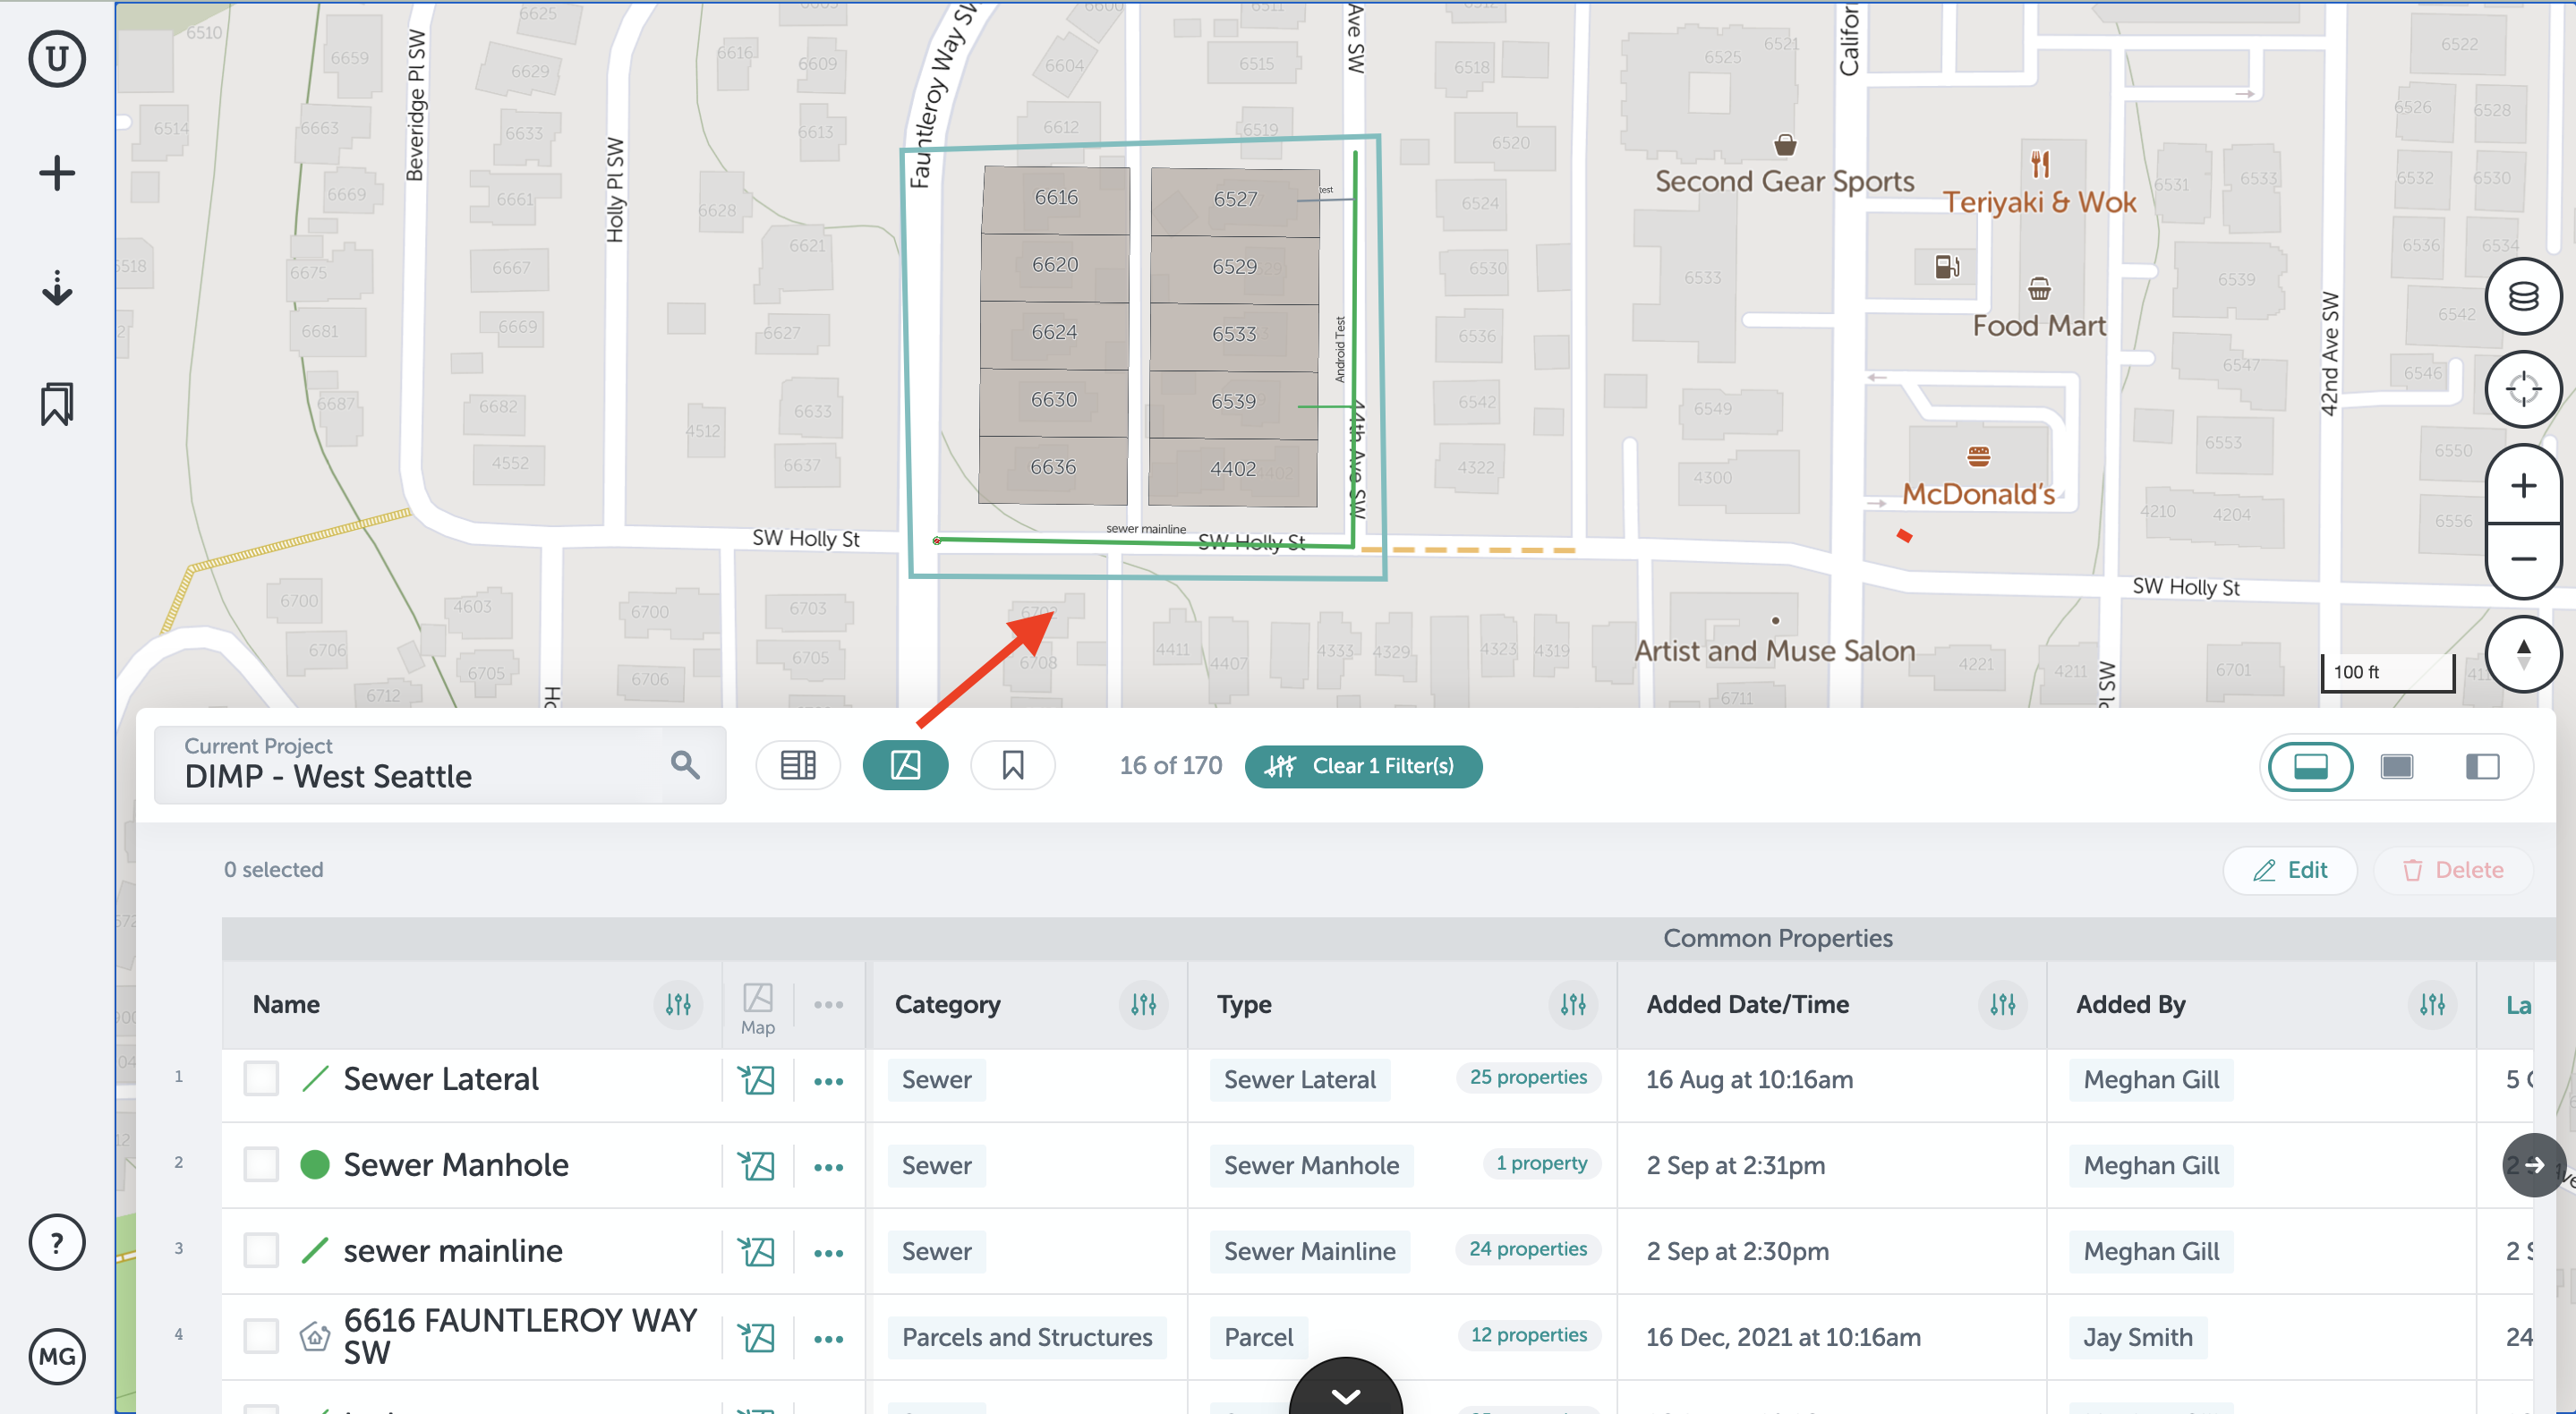
- Now you can see the filter is applied, and only the assets within the boundary are displayed.
Mapped:
- The "Mapped" filter will show only assets that have a physical representation on the map - this will exclude unmapped assets, which often consist of files, reports, or anything that has been removed from the map.
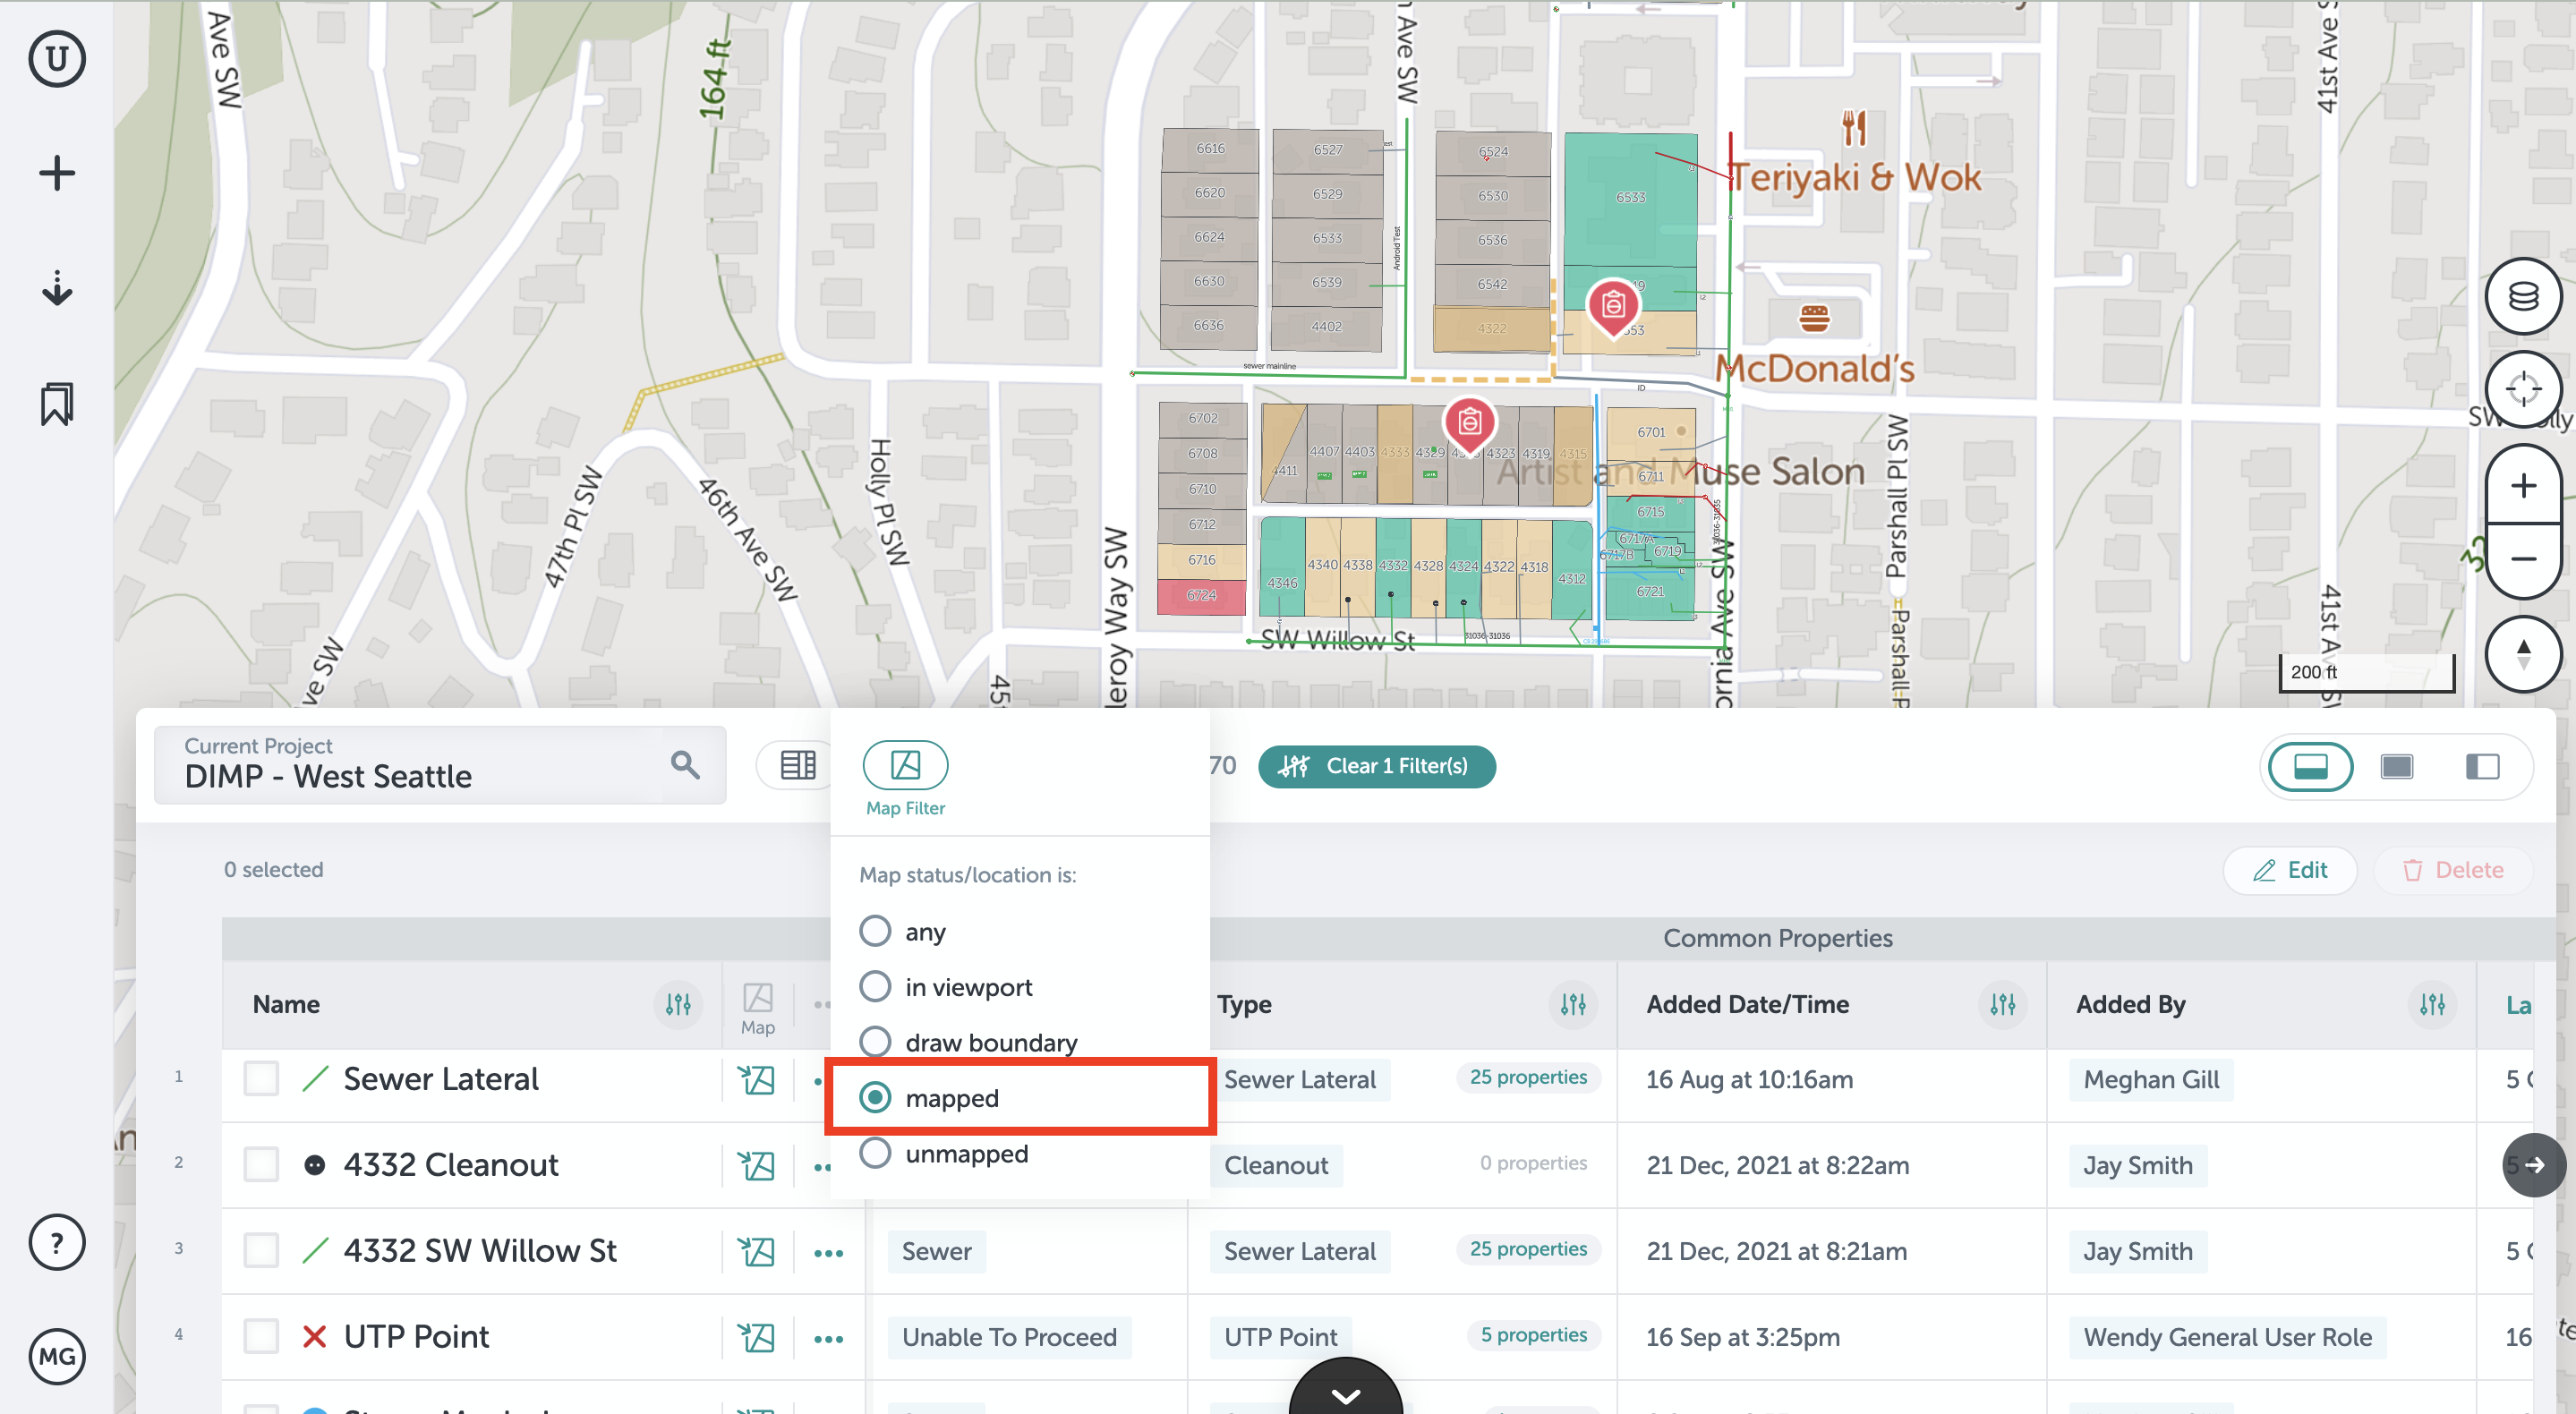
- Click the "Mapped" option to apply the filter and view only mapped assets.

Unmapped:
- The "Unmapped" filter does the opposite of selecting “mapped,” where only unmapped assets are displayed. These will only appear in the table view since they have no physical representation on the map. A good use for this filter is to identify assets that still need to be placed on the map.
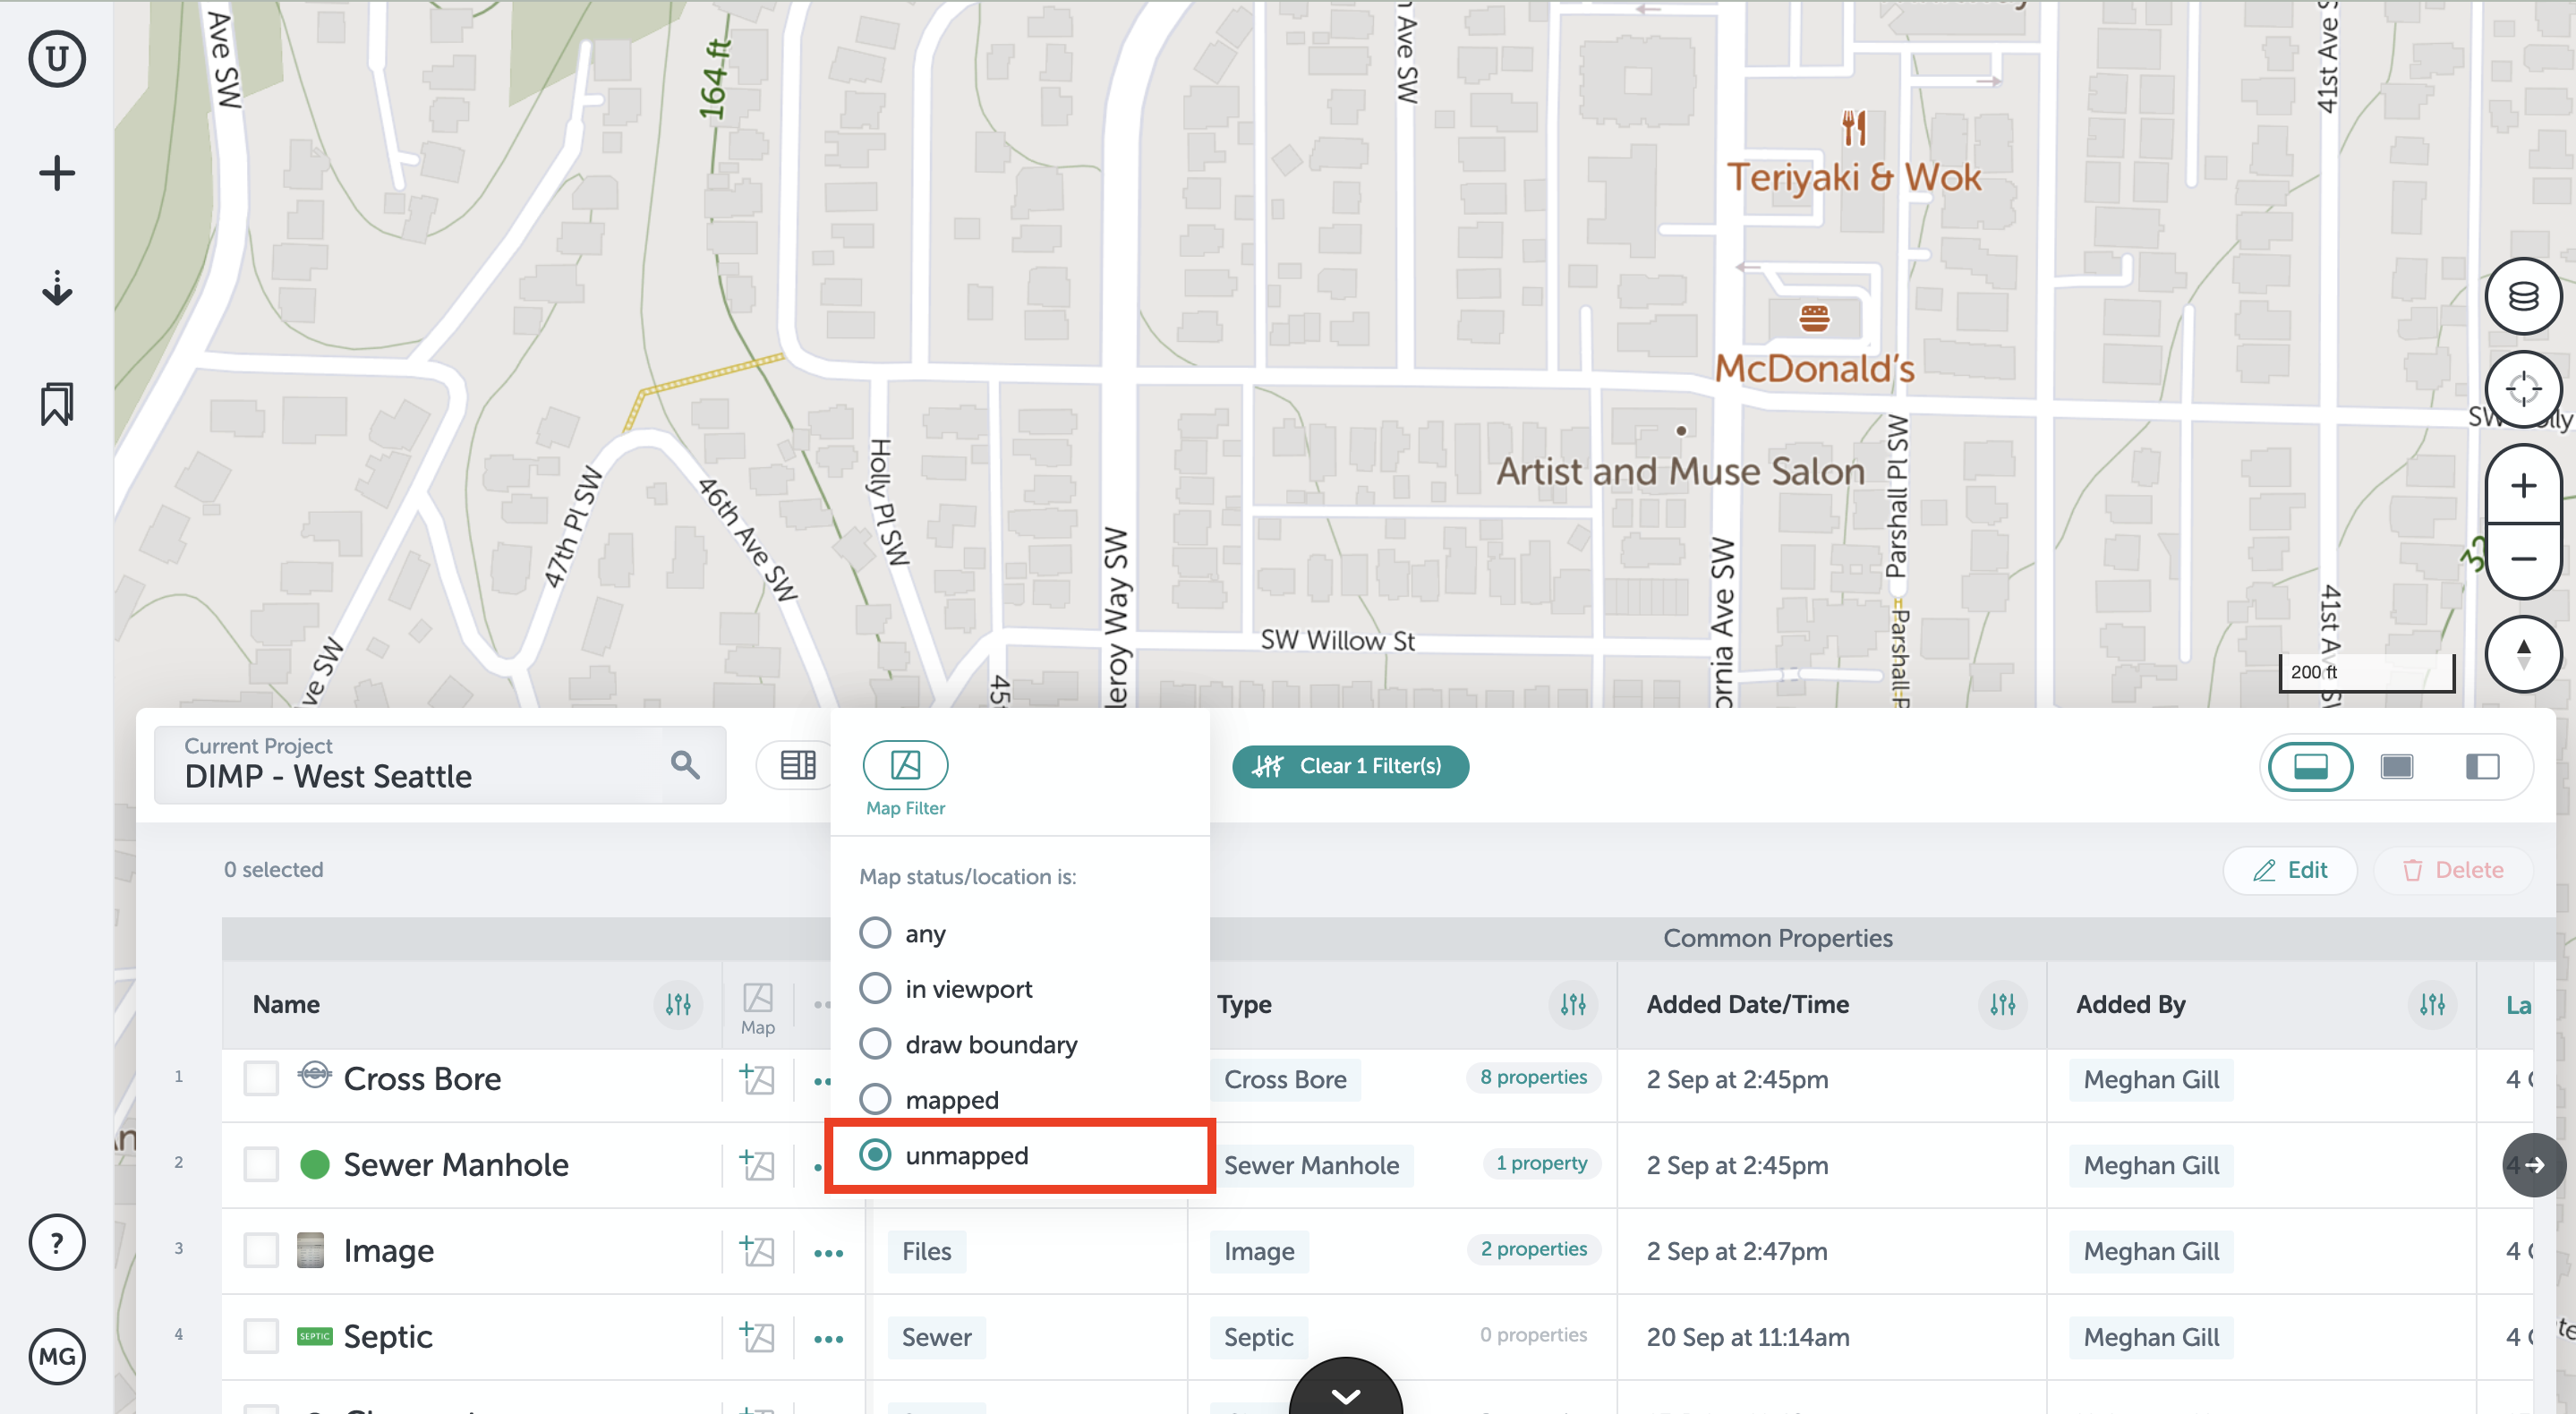
- Click the "Unmapped" option to apply the filter and view only unmapped assets.
Filter Details and Clearing Filters
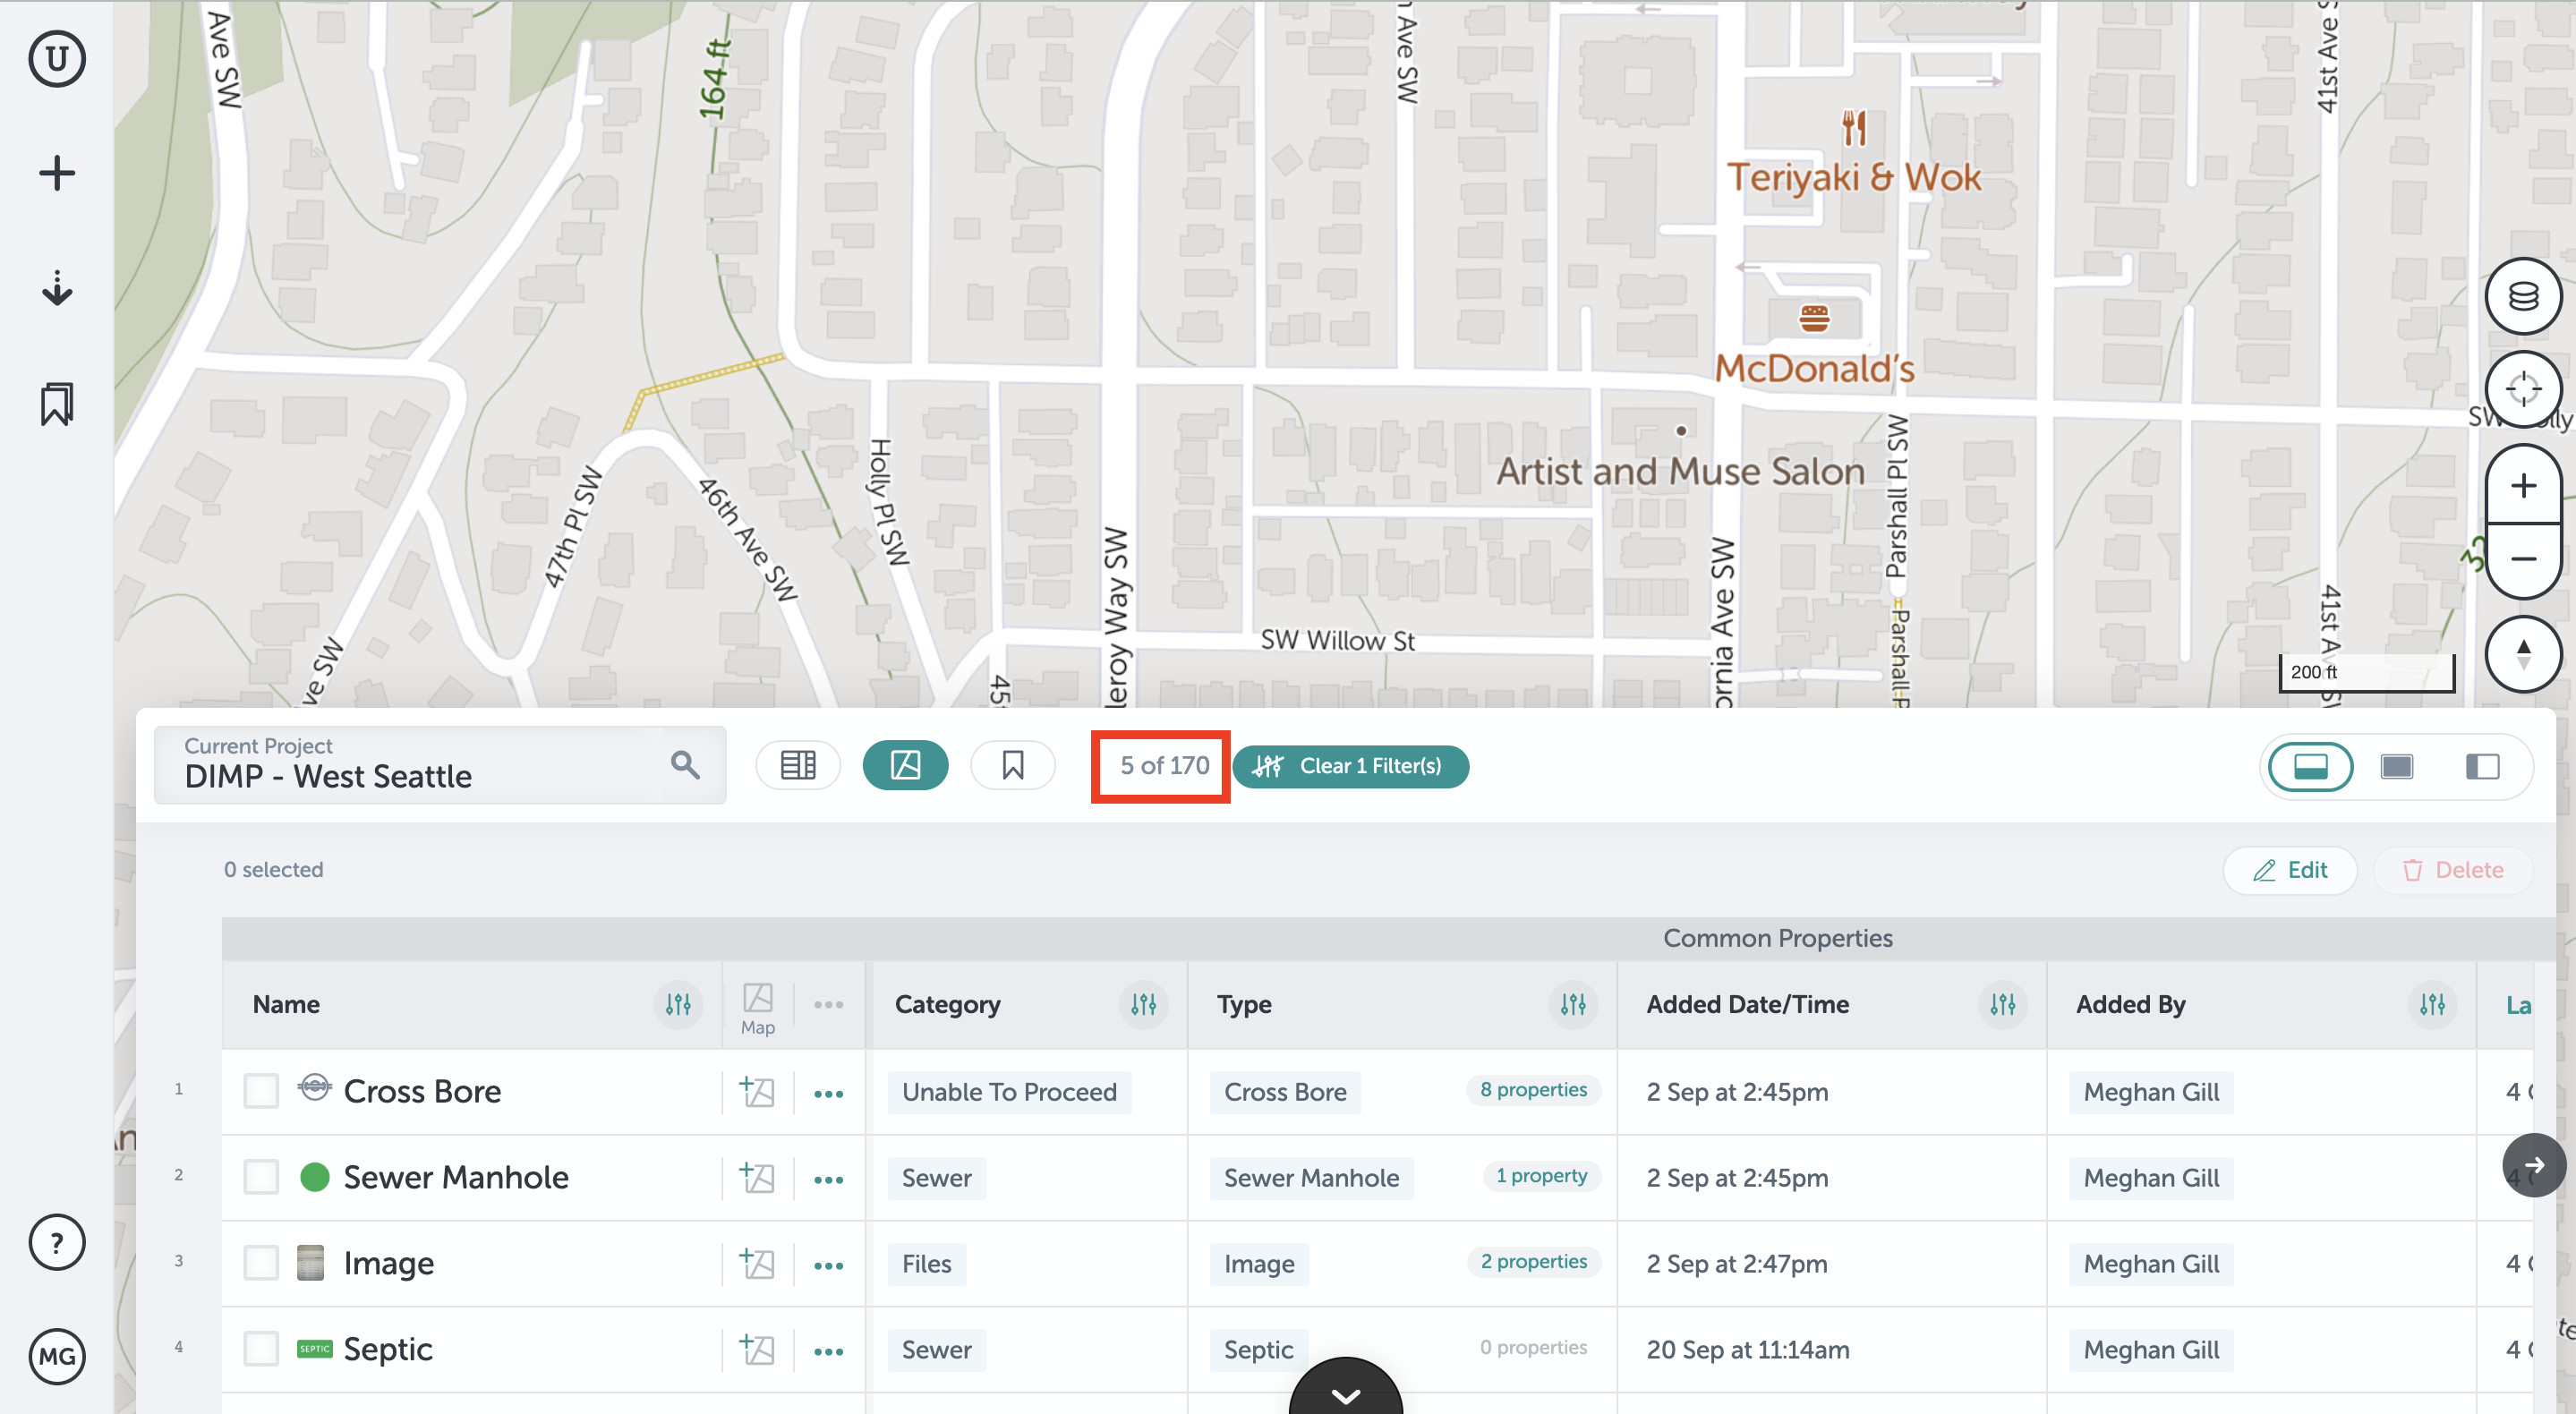
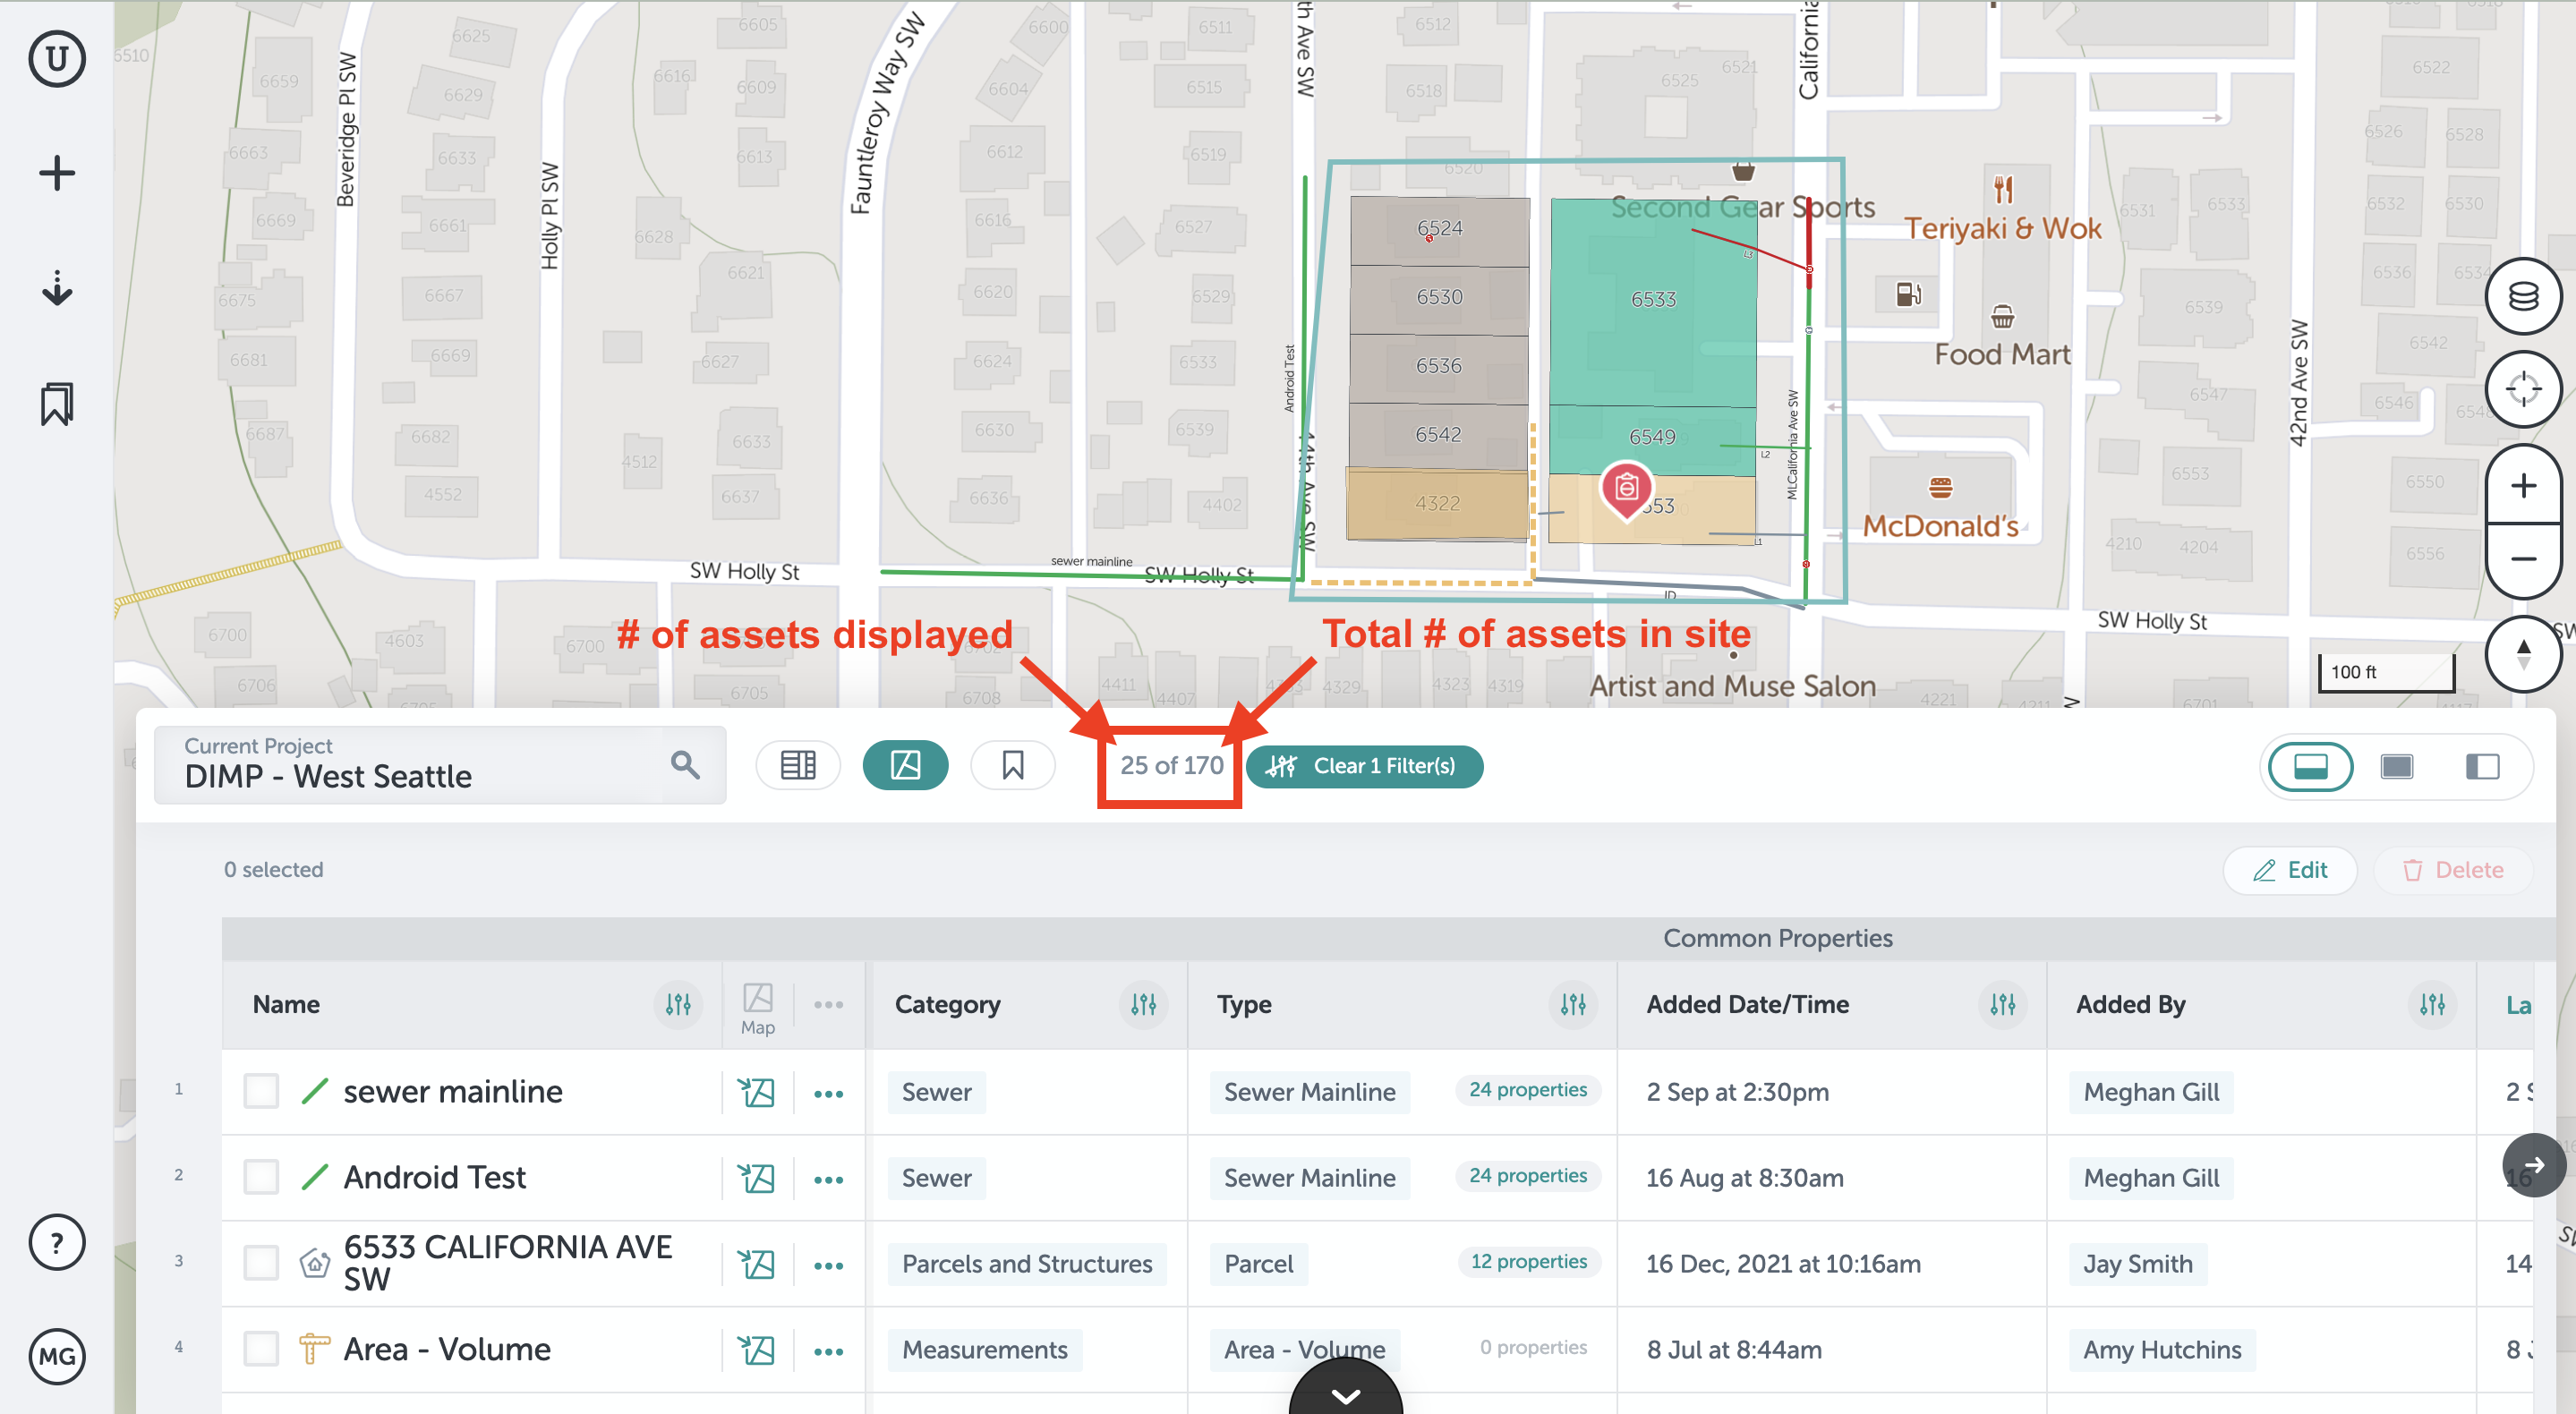
- When filters are applied, you can see the number of assets currently displayed shown at the top of the Table View, along with the total number of assets in the project.
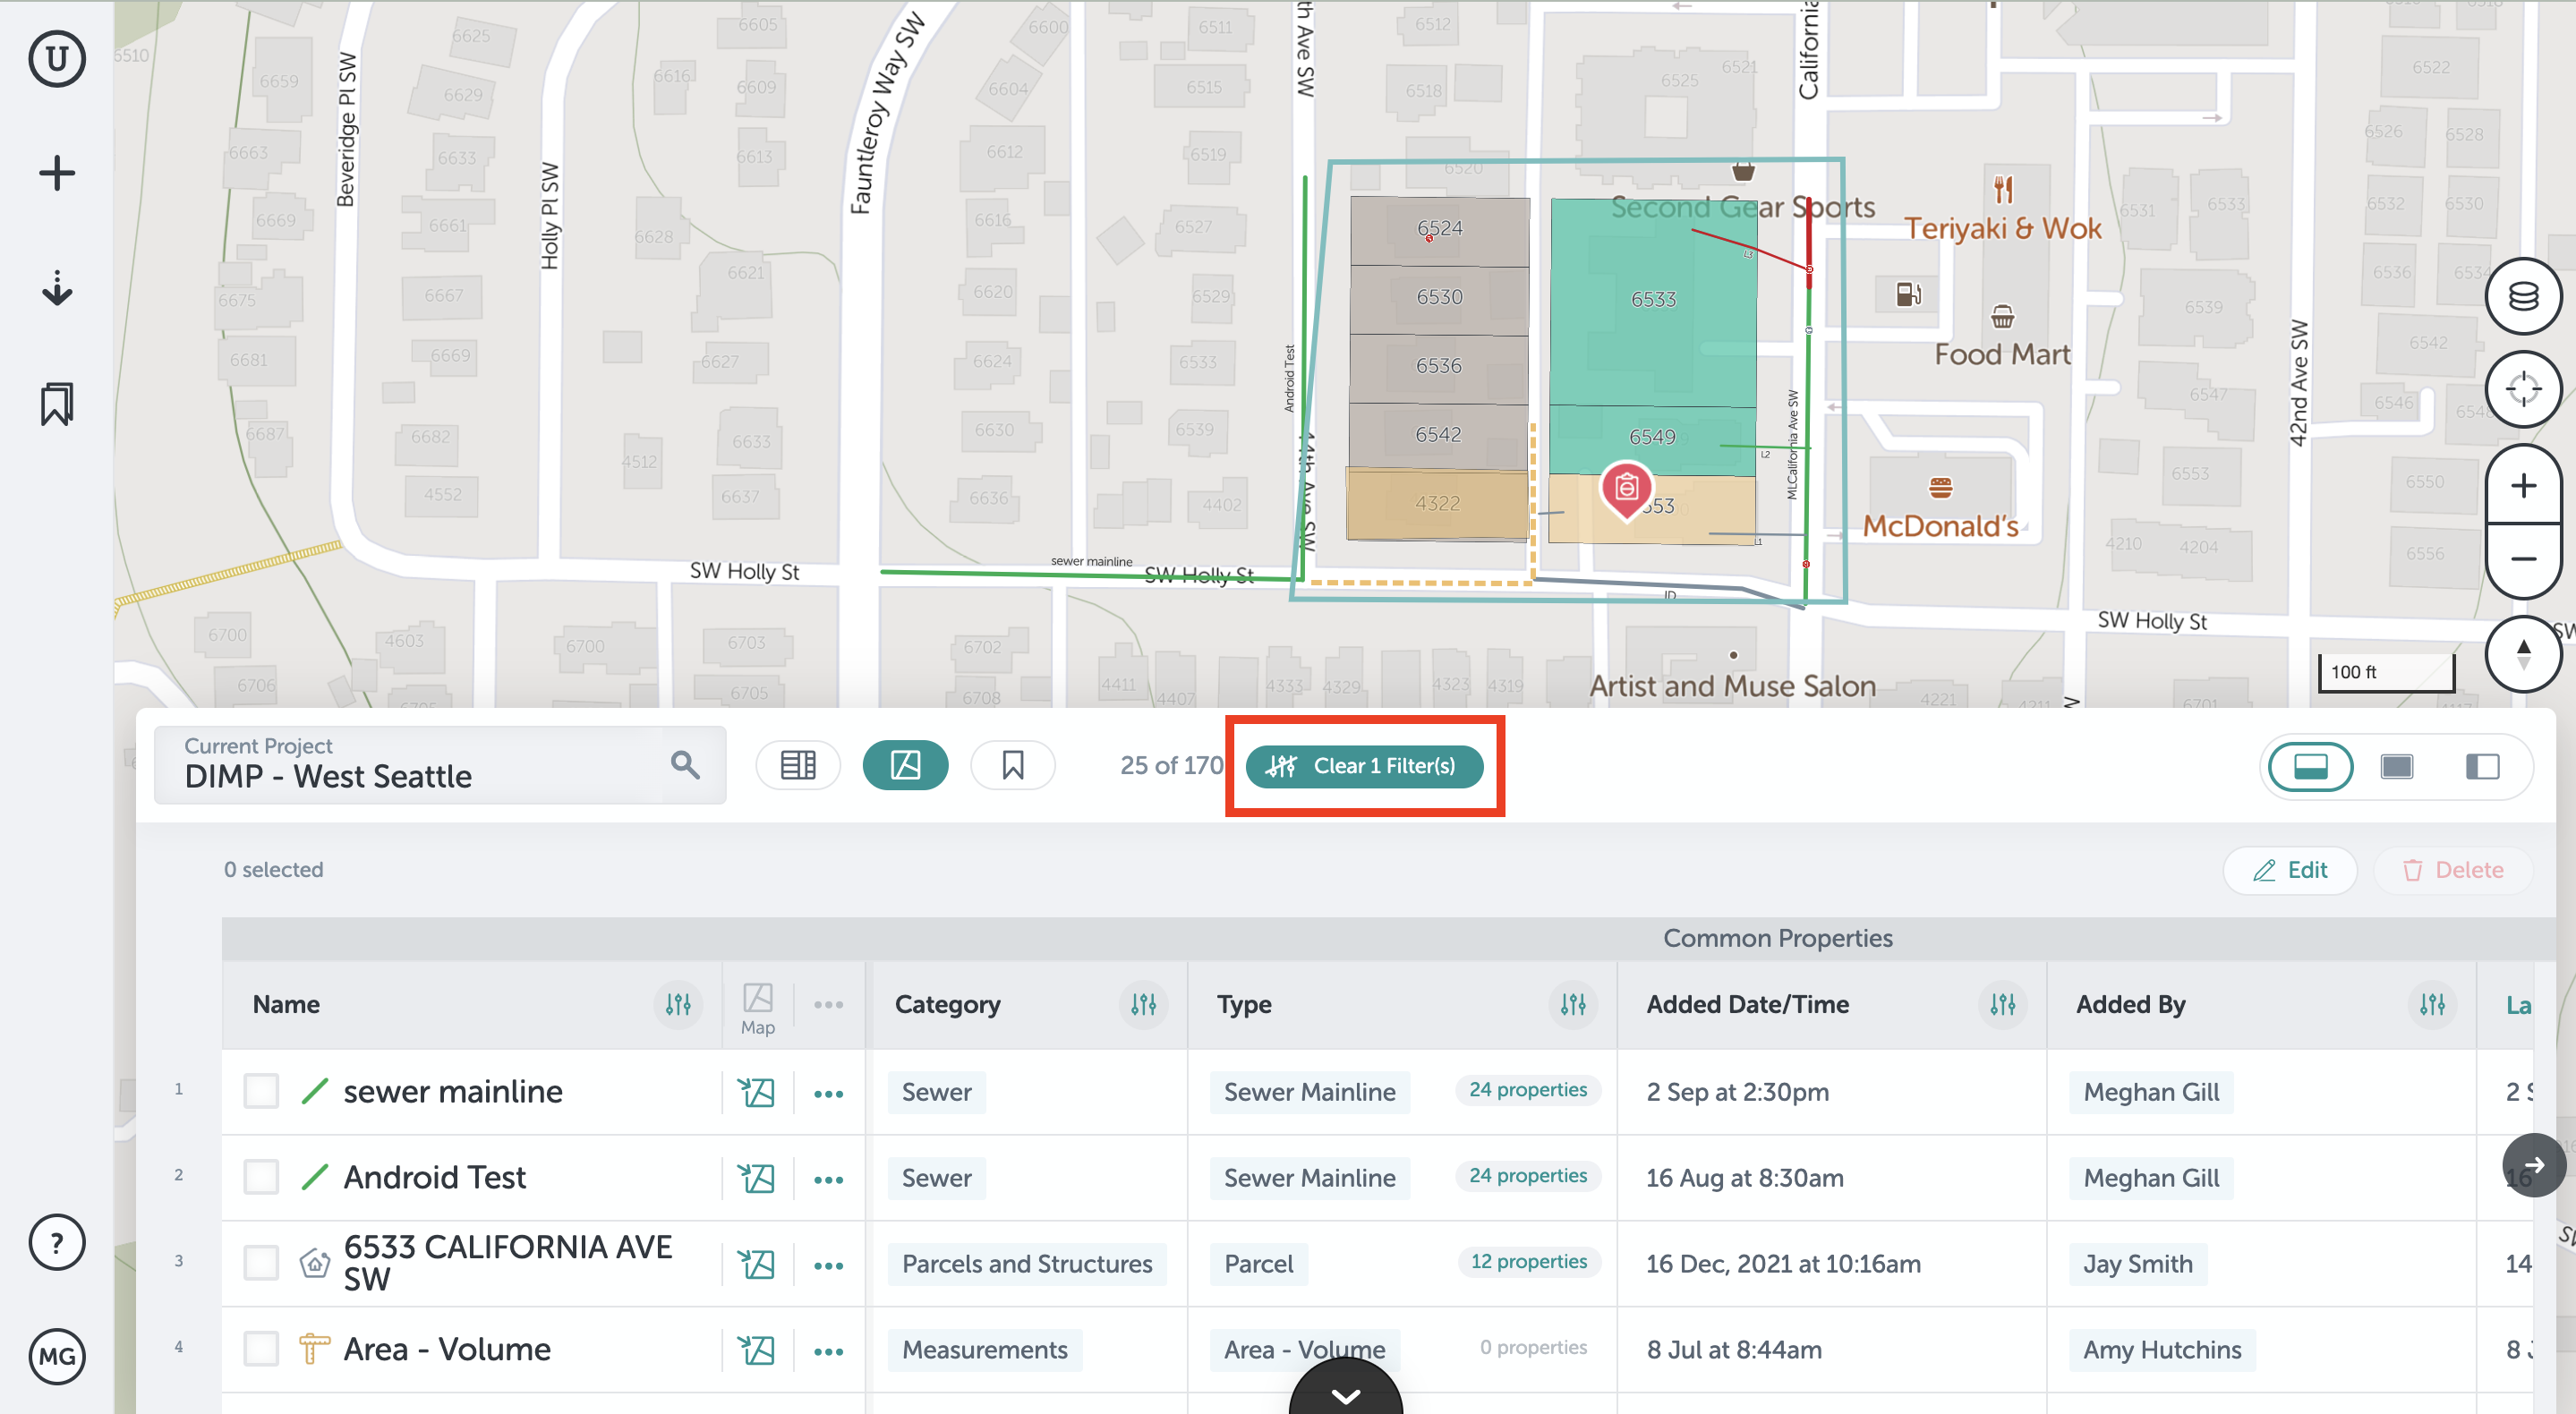
- To clear filters and view all data again, click "clear filters"
- Once you've set filters, you can export the table and your export will reflect the content that is remaining in the table after the applied filters. If you have applied filters to your site, they will be saved to your site unless you click the "Clear Filters" button.
If you run into any issues or have any questions, please reach out to us at support@unearthlabs.com.
Revised October 2022